
The Difference Ten Years Makes
Posted Monday, January 03 2011
It's a new year and a new decade, but I want to take one more look at the first decade of the 21st century by way of a handful of economic measures that are of primary importance to Americans. This list is surely incomplete, but I think it captures the overall economic experience and mood of the past ten years. All measures below are inflation adjusted where appropriate (see the table below for details).
10 Year Changes in Broad Economic Measures
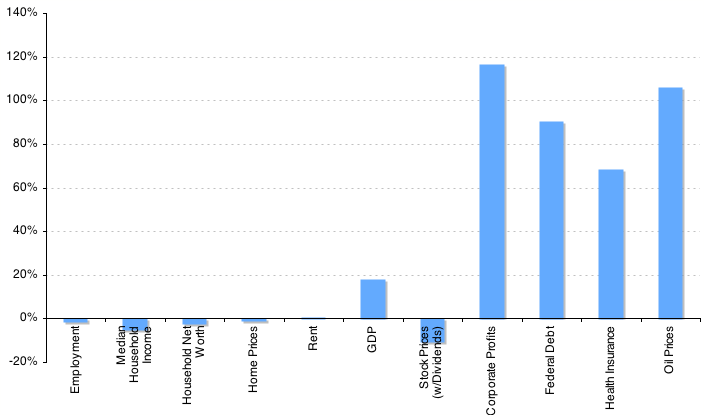
The two broadest measures of economic well-being for the average American, in my mind at least, are employment and median income. Over the past ten years we've experienced a small decline in both. The employment picture is especially grim as the population has grown by more than 27 million (9.7%) over a period where the economy has lost jobs. It could be argued that in 2000 we were at the peak of a boom and in 2010 we're coming out of a recession, but it's still not common for the US to go ten years without creating a significant net number of new jobs.
Household net worth also fell over the course of the decade. Sadly, the total household net worth measure probably underestimates the impact on the median family or household because it measures aggregate wealth which has a tendency to be skewed. The Fed only releases its Survey of Consumer Finances (which includes the median net worth measure) every 3 years, so we don't yet know what median net worth values will be for 2010. We do know, however, that median net worth measures are significantly higher for homeowners and the last 3 years certainly haven't been the most favorable for that particular asset.
Having said that, let's not forget that home price growth in excess of inflation is not an inherently good thing. With median household incomes down, one wouldn't expect home prices to rise much (or at least I wouldn't). I would even argue that a significant increase in home prices without a corresponding rise in median income is a net negative for the economy, but I think we've all come to appreciate the drawbacks of inflated home prices over recent years.
It's interesting to note that home prices and rents have done about the same thing over the past ten years, that is they're both relatively flat. Of course we had a giant run up in home prices followed by a dramatic crash while rent increased roughly in line with inflation. Sequence and magnitude matter I guess.
The business and financial economy has seen varied results over the last ten years. Real GDP has grown more than 17% since 2000, but the stock market (on an inflation adjusted basis) is down just over 10%. Perhaps more surprisingly in light of that decline, corporate profits have surged an amazing 119% even after adjusting for inflation! We've grown our public debt by 90% in that time as well. One would like to think that growing GDP and corporate profits would help the federal financial picture and lifts stock values, but the last decade has demonstrated otherwise. Again, one can argue that the timing of these measures coming at the height of a boom and the middle point of a bust throws things off here, but it should be clear that no economic system can continue in this manner forever.
Finally, health insurance costs and oil prices must be mentioned. I point these out only because they're measures we were somewhat less concerned with ten years ago. In the context of declining income, jobs and net worth, the rise of health insurance premiums and oil — two things that we all directly or indirectly pay for — is a drain on individual and family economic resources that is hard to trim.
All the data for the chart above is detailed in the table below. Nominal values for 2000 were adjusted by the CPI to achieve an inflation adjusted value for 2010.
10 Year Changes in Broad Economic Measures Table
| Metric | 10 Years Ending | From | To | Change |
|---|---|---|---|---|
| Employment | 12/2010 | 132,347,000 | 130,539,000 | -1.37% |
| Median Household Income | 12/2009 | $52,388 | $49,777 | -4.98% |
| Household Net Worth | 9/2010 | $55,957.73B | $54,891.17B | -1.91% |
| Home Prices (Index) | 9/2010 | 134.27 | 133.22 | -0.79% |
| Rent (OER Index) | 11/2010 | 255.391 | 257.192 | 0.71% |
| GDP 1 | 9/2010 | $11,267.867B | $13,278.515B | 17.84% |
| S&P 500 Index 2 | 12/2010 | 140.53 | 125.75 | -10.52% |
| Corporate Profits | 9/2010 | $645.59B | $1,416.3B | 119.38% |
| Federal Debt | 12/2010 | $7,267.79B | $13,834.92B | 90.36% |
| Health Insurance (Family) | 12/2010 | $8,180 | $13,770 | 68.33% |
| Oil Prices | 11/2010 | $41.36 | $85.28 | 106.2% |
For another look at the year in numbers, check out Calculated Risk's 2010 charts. And if all these numbers leave you thinking it was a pretty crummy decade, Charlie Stross' Reasons to be Cheerful post might change your mind. The last ten years were pretty fantastic for a large fraction of the world's population. For Americans used to ever rising standards of living, however, the last ten years didn't provide the usual clear and unambiguous gains for the average household.
1. GDP is reported in 2005 dollars. It's adjusted for inflation but not directly comparable with the other measures reported in 2010 dollars. ↩
2. The S&P 500 returns are an approximation calculated from the SPY ETF. It includes dividends and is adjusted for inflation. If you look at the closing price of the S&P 500 it will be very different. ↩
