How Much Have Americans Saved for Retirement
Posted Monday, March 21 2011
The Employee Benefit Research Institute released its annual Retirement Confidence Survey last week which, as the name suggests, measures Americans' confidence in their retirement prospects. It also provides the best annual look at how much American households have saved for retirement excluding the value of their homes and any defined benefit plans. In essence, the survey reflects what Americans have amassed in 401Ks, IRAs and savings accounts.
We've long heard about the poor job Americans are doing saving for retirement, so perhaps these mediocre numbers shouldn't come as a surprise. Nevertheless, it's clear that Americans' ambitions for retirement savings continue to fall well short of the reality of those savings, and understanding the disconnect is worth the effort. But let's stop speaking in general terms here and get specific.
Workers' Household Savings
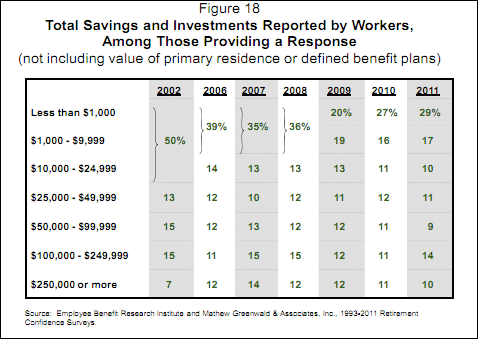
The chart below comes directly from the report and shows total household savings and investments accumulated by people still working. In the table directly below the chart I've re-binned the data to show the percentage of American workers who have saved less than $25K, $100K and $250K. I think it's a little more telling in that form.

RCS Total Household Savings and Investments for Workers (inferred from chart)
| Total Savings | 2002 | 2006 | 2007 | 2008 | 2009 | 2010 | 2011 |
|---|---|---|---|---|---|---|---|
| Less than $25,000 | 50% | 53% | 48% | 49% | 52% | 54% | 56% |
| Less than $100,000 | 78% | 77% | 71% | 73% | 75% | 77% | 76% |
| Less than $250,000 | 93% | 88% | 86% | 88% | 87% | 88% | 90% |
As the report and chart note, 56% of workers had savings of less than $25,000 in 2011 and only 10% had savings of $250,000 or more. The survey also found that 58% workers say they will need more than $250,000 in retirement, so there's quite a gap to close.
Another way of thinking about this is to consider the median household savings for workers. The report doesn't show this, but it would be equivalent to the 50% point for savings. Since 56% of workers have less than $25K saved, the median household (which 50% of households are above and 50% are below) must have slightly less than $25,000 saved.
Retirees' Household Savings
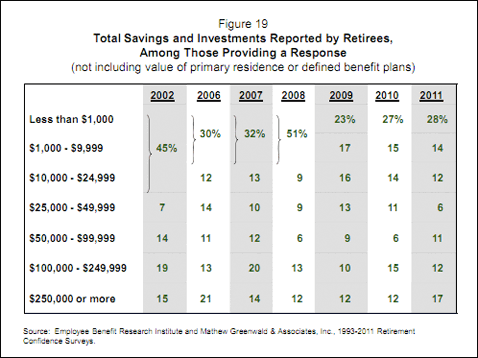
The chart and table below tell the story from the perspective of retirees. We saw above that 56% of workers had less than $25K saved, but it's even more shocking to see that 54% of retired households have less than $25K in savings.

RCS Household Savings and Investments for Retirees (inferred from chart)
| Total Savings | 2002 | 2006 | 2007 | 2008 | 2009 | 2010 | 2011 |
|---|---|---|---|---|---|---|---|
| Less than $25,000 | 45% | 42% | 45% | 60% | 56% | 56% | 54% |
| Less than $100,000 | 66% | 67% | 67% | 75% | 78% | 73% | 71% |
| Less than $250,000 | 85% | 80% | 87% | 88% | 88% | 88% | 83% |
One of the warnings the report mentions is that while more people expect to work in retirement, few actually do. Making up for inadequate savings with part-time work in retirement just may not be an option:
The RCS has consistently found that workers are far more likely to expect to work for pay in retirement than retirees are to have actually worked. The percentage of workers planning to work for pay in retirement now stands at 74 percent (up from 70 percent in 2010), compared with just 23 percent of retirees who report they worked for pay in retirement.
To add insult to injury, the option of working longer is not always achievable either:
The RCS has consistently found that a large percentage of retirees leave the work force earlier than planned...some workers are likely to find themselves vulnerable to an unplanned early retirement.
Cheery. On an optimistic note, the report speculates that workers are becoming more realistic about retirement savings needs and that falling optimism may actually result in better savings habits and retirement outcomes. Check back next year to judge the progress towards that goal.
It's also worth repeating that the survey doesn't measure the value of defined benefit plans (like pensions), home equity or Social Security. All three of these have traditionally played a very large role in retirement finances and will continue to play a significant role in the future as well. Increasingly, however, Americans have to supplement these traditional retirement income sources with their own savings. The Retirement Confidence Survey does a very good job of measuring that component.
Other Report Highlights
- Instead of making fundamental adjustments to their spending and saving patterns in response to the decline in [retirement] confidence, workers continue to change their expectations about how they will transition from work to retirement.
- The age at which workers expect to retire continues its slow, upward trend. In particular, the percentage of workers who expect to retire after age 65 has increased over time, from 11 percent in 1991 and 1996 to 20 percent in 2001, 25 percent in 2006, and 36 percent in 2011.
- While $25 a week may not seem to be a significant amount of money, someone who managed to save this amount for a year would accumulate $1,300, which is more than 29 percent of workers report having accumulated in total.
- Debt is also a problem for a significant number of workers. Twenty-two percent report their level of debt is a major problem.
The full report, while long, is well worth the read.

