
Government Expenditures as a Fraction of GDP
Posted Wednesday, February 02 2011
Update: I've added a page with always up-to-date government expenditures as a fraction of GDP data along with revenue, deficit and total debt data as well.
I read Tyler Cowen's new book The Great Stagnation twice over the weekend and got more out of it than just about anything I've read in the last year. He does a wonderful job illuminating the core challenges the US is facing in the 21st century — namely, a lack of easily exploited low-hanging fruit. Low-hanging fruit here refers to activities that can relatively easily be converted into productive economic endeavours (e.g. educating large amounts of formerly uneducated, exploiting technological discoveries, building and farming on widely available land, creating various networks to ease commerce etc..).
I imagine I'll have more to write on the big picture ideas that the book lays out, but for now I want to focus on some of the details it highlights. This is likely to be the first post in a series as I have about half a dozen notes that say make chart in reference to metrics that Cowen points out.
For instance, in the second chapter Cowen suggests that we may not be as productive as we think we are with the argument that new marginal dollars spent by the government are less productive than previous dollars spent. He is not demonizing or arguing against government spending here, he's simply saying that there is, on average, less economic return on a dollar spent by the government as the amount of government spending increases. He gives the example of building a new road versus repaving an existing one. The former likely creates more value than the latter, but that doesn't mean the latter isn't worth doing. I think this is a sound argument, but you should read the book to see his full reasoning (which includes a discussion about the problems associated with cost versus price accounting).
After reading this section, I wanted to see two charts. The first is government expenditures as a fraction of GDP over time.1
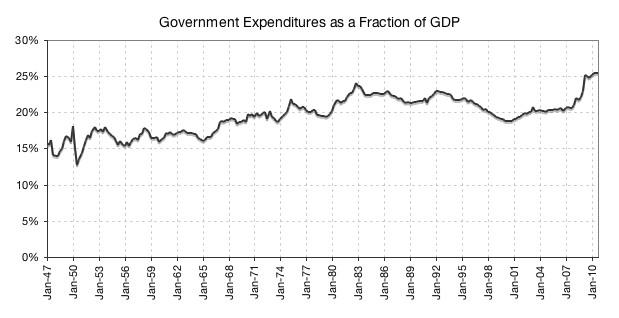
If Cowen's right that Federal expenditures are not as productive as we think they are, then the increasing fraction of GDP accounted for by government spending is not as valuable as the dollar amount we assign to it. Like I said before, it's not that it's without value, and it doesn't mean that it's not a necessary expense. It just means that we may be overvaluing its contribution to GDP. It's a measurement problem.
So, obviously, the next thing you want to see is GDP growth with government expenditures removed. The chart below shows the rolling ten year total growth in real GDP and real GDP excluding government expenditures.2
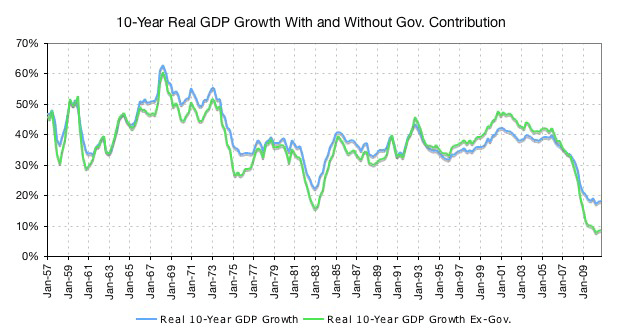
This chart tells us that more than half of our economic growth in the past ten years has come from government spending. For the 10 years ending in Q4 2010, real GDP grew 18.07%. Real GDP less government expenditures grew 8.46%. When you see this chart it becomes apparent why job growth, median income and the stock market are down over the last decade. It certainly looks like Great Stagnation from this perspective.
