
Real Home Prices and Real Borrowing Costs Since the Bottom
Posted Tuesday, February 04 2014
I previously showed that continuously declining interest rates since 1980 have been a boon to the buying power of homeowners despite stagnant incomes. After the bursting of the housing bubble last decade and subsequent fall in home prices, the historically low interest rates that followed led to remarkably low payments for borrowers who could still qualify for mortgages these past few years. But we've long since put in a bottom for home prices. According to Case-Shiller's 20 city aggregate that bottom came in February of 2012.
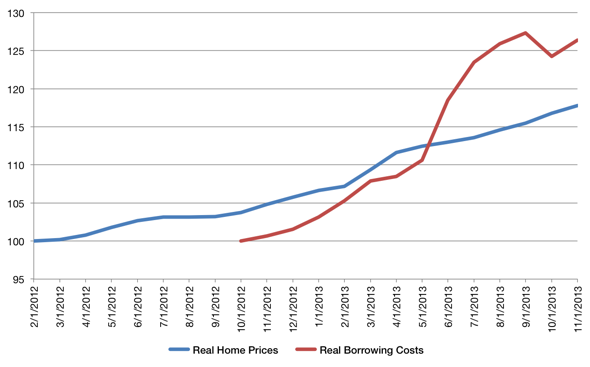
The chart above shows the change in real home prices (blue line) since the bottom. After February 2012 home prices began to rise while mortgage rates continued to fall. They fell enough in fact that their declines offset the rise in real home prices for another 8 months. That is, a borrower could obtain a lower mortgage payment via falling borrowing costs despite rising home prices. The bottom in terms of a monthly mortage payment didn't come till October of 2012. The red line shows how mortgage payments have changed since then.
In short, real home prices have risen about 17% since the February 2012 bottom, but the real price in terms of borrowing costs have risen just over 26%. I don't expect rates to leap in the near future, but if rates continue to rise with Fed tapering (they're up about one percentage point from the bottom) it could have a notable impact on affordability for first-time buyers. On the other hand, low existing home inventory suggests there hasn't been a significant falloff in demand yet and mortgage rates have been trending down again recently as well.
