
Comparing CES and CPS Employment
Posted Wednesday, May 26 2010
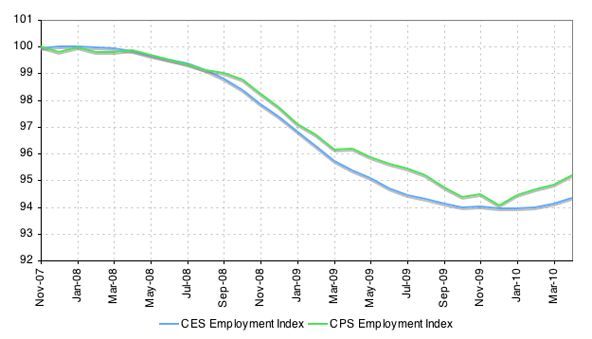
The BLS jobs number is certainly one of the most anticipated pieces of data released each month. The headline number that we all talk about is from the Current Employment Statistics survey (CES), but there's another employment estimate from the Census' Current Population Survey (CPS) that gets less attention. While the headline CES jobs number is now 0.44% above its December 2009 low, the CPS employment has increased 1.21% from the same month. The chart below illustrates the change in the two employment measures since employment peaked in December 2009 (November for the CPS measure). The index for each is set to 100 at their respective peaks.
CES & CPS Employment Index Since Peak Employment
So what does this mean? Let me back up a bit and quickly explain the difference in these two employment measures. The headline jobs number from the CES survey (also know as the establishment or payroll survey), counts the number of employees on employer payrolls. The CPS employment number comes from a survey of households for employed individuals (thus its alternative name — the household survey). The CPS is also where the unemployment rate data comes from. Calculated Risk has a good post explaining further how these measures relate to the unemployment data. At first blush one might expect that these two surveys measure the same thing in a different way, but there are subtle differences that make them fundamentally different metrics.
Imagine an individual already working part-time takes a second part-time job to increase his income. On the CES survey, one more job has been added to the payroll (both surveys count part-timers by the way). The CPS, however, does not count this in its employment number because the person was already employed and they're counting employed individuals not unique jobs. So while the CES employment number would go up when this person takes the new part-time job, the CPS employment number would remain the same.
Given that brief introduction, let's see how these two employment metrics have compared over a longer period. Below is a chart of CES and CPS employment since 2000. It's the same thing as above just going back to 2000.
CES & CPS Employment Index Since 2000
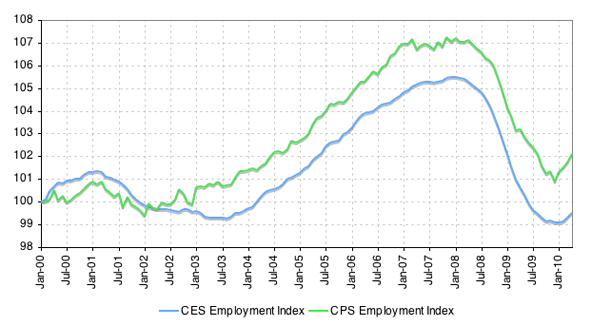
The first thing that stands out is the divergence in the two employment metrics over the course of the decade. Interestingly, most of that divergence occurred around the time of the recovery from the 2001 recession. Officially, that recession ended in November of 2001, but we all remember the "jobless recovery" that kept jobs (as measured by the CES survey) from growing until September 2003. CPS employment turned up in February of 2002. How can we explain this?
First of all, we're not quite comparing apples to apples yet. The CPS employment count includes sectors and types of jobs that CES employment does not. The CES survey does not count "proprietors, self-employed, unpaid family or volunteer workers, farm workers, and domestic workers."1 CPS employment definitions are broader and include essentially anyone who has done "work for pay or profit during the week."2 The two largest components found in the CPS that are not measured in the CES are farm workers and the self-employed. Fortunately the BLS breaks out those categories, so we can subtract them out of the CPS data to get a more comparable metric. The chart below is just like the one above except we've subtracted out the farm and self-employed workers from CPS employment.
CES & CPS (Ex Farm and Self-Employed) Employment Index Since 2000
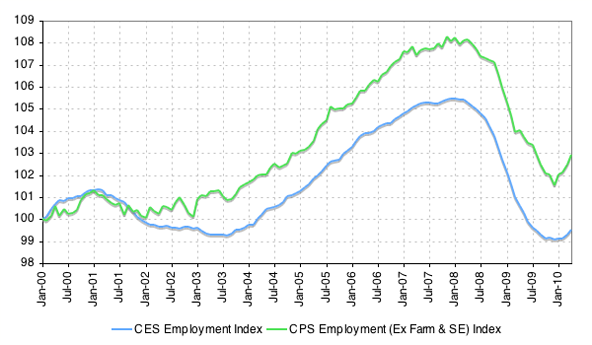
It seems the difference in the employment can't be explained by farm workers or the self-employed. It turns out the number of individuals working in these two sectors held pretty constant over the decade, so the CPS employment index actually rose more against CES employment index with these two categories removed. Remember we're not talking about absolute numbers here; the comparison is relative. However, now that we've adjusted the CPS employment number to remove agriculture and self-employment jobs that are not measured in CES employment, an absolute comparison makes more sense. Here's that chart.
CES & CPS (Ex Farm and Self-Employed) Employment Since 2000
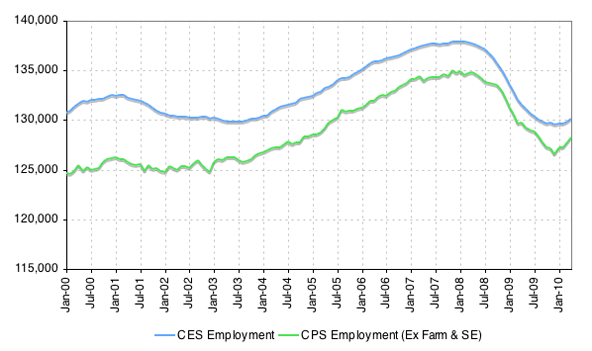
As the chart above shows, adjusted CPS employment is lower than CES employment. This makes sense, remember, because the CES survey will count each job while the CPS will count individuals only once regardless of how many jobs they have. Thus, one expects the CES employment figure will be higher.
So what does it mean that the adjusted CPS employment figure is rising more quickly than the CES figure? I think we can make a guess at it at least. Imagine that guy I talked about in the beginning working two part-time jobs gets an offer for full-time work at one of them which he accepts. He quits his other part-time job and his position is immediately filled by someone else. What do the surveys record? The CES survey records no new employment, because it's counting unique jobs. The CPS, however, does record an increase in employment because it's counting individuals with jobs (this assumes the new part-timer didn't have another job somewhere else). So perhaps what we're seeing now is more people entering the workforce to fill vacant existing positions as some part-time jobs get upgraded to full-time gigs. Can we test for this? Unfortunately we can't because the there's no way to get part-time jobs out of the CES survey. Thus it remains only a guess.
As for whether CPS employment growth outpacing CES employment growth is a good thing or not, I'm inclined to think it is. All things being equal, I tend to think the number of people employed is more relevant than the total number of jobs created. If in a tiny island economy of 10 people there were 10 jobs available, would it be better for 5 to be unemployed and 5 to work two jobs or for all 10 to each work one of the available jobs? The latter seems like a better arrangement to me. Perhaps it says something about employment flexibility in the economy though. The option of having multiple part-time jobs might be declining as adjusted CPS employment approaches CES employment.
But since the CPS employment number presaged further job growth in the recovery from the 2001 recession, perhaps we can look at its strong growth now as an indicator of future strength in CES job growth. This, however, is wild speculation, so don't put too much stock in it. Either way, I think it will be worth while to pay attention to both measures as the economy recovers.
By the way, CPS employment in April was up 1.33% from the December low if you use the adjusted measure. The 1.21% increase I referred to at the top included agricultural jobs and the self-employed.
Update: CR pointed out this monthly report (pdf) produced by the BLS that compares CES and CPS employment. There is a lot of research going on in this area, but it seems the issue remains an open question to some degree. In short, potential reasons for the discrepancy are sample size (the CES survey is much larger), statistical adjustments, worker classification (including off the book workers) and job changers. There's a ton of information in the report and I'm finding even more as I explore the referenced links within it.
