<?xml version="1.0" encoding="utf-8"?>
<feed xmlns="http://www.w3.org/2005/Atom">
  <title>Department of Numbers</title>
  <link rel="alternate" type="text/html" href="http://www.deptofnumbers.com/blog" />
  <link rel="self" type="application/atom+xml" href="http://www.deptofnumbers.com/blog/feed" />
  <id>tag:www.deptofnumbers.com,2009-07-06:/blog</id>
  <updated>2012-05-06T08:33:58-07:00</updated>
  <entry>
    <title>Inflations: Consumer Prices and Income</title>
    <link rel="alternate" type="text/html" href="http://www.deptofnumbers.com/blog/2012/05/inflations" />
    <id>tag:www.deptofnumbers.com:2012-05-06:/blog/2012/05/inflations</id>
    <published>2012-05-06T08:33:58-07:00</published>
    <author>
      <name>Ben Engebreth</name>
      <uri>http://www.deptofnumbers.com</uri>
    </author>
    <updated>2012-05-06T08:33:58-07:00</updated>
    <content type="html" xml:lang="en" xml:base="http://www.deptofnumbers.com">
      <![CDATA[ <p>One of the reasons economic and financial systems are so fascinating is that they are complex.  Of course this is also one of the reasons why they are so frustrating.  A current fascination/frustration of mine is inflation and its transmission through the economy.  I readily admit that it is a complex beast whose workings I don't fully understand, so consider the following thoughts an exploration.</p>
<p>There has been much talk lately about how a period of modest inflation will benefit the economy.  This makes sense to me given the broadest definition of inflation.  In an economy overburdened by debt, decreasing the real value of those debts via inflation will improve the debt load on the borrower.</p>
<p>
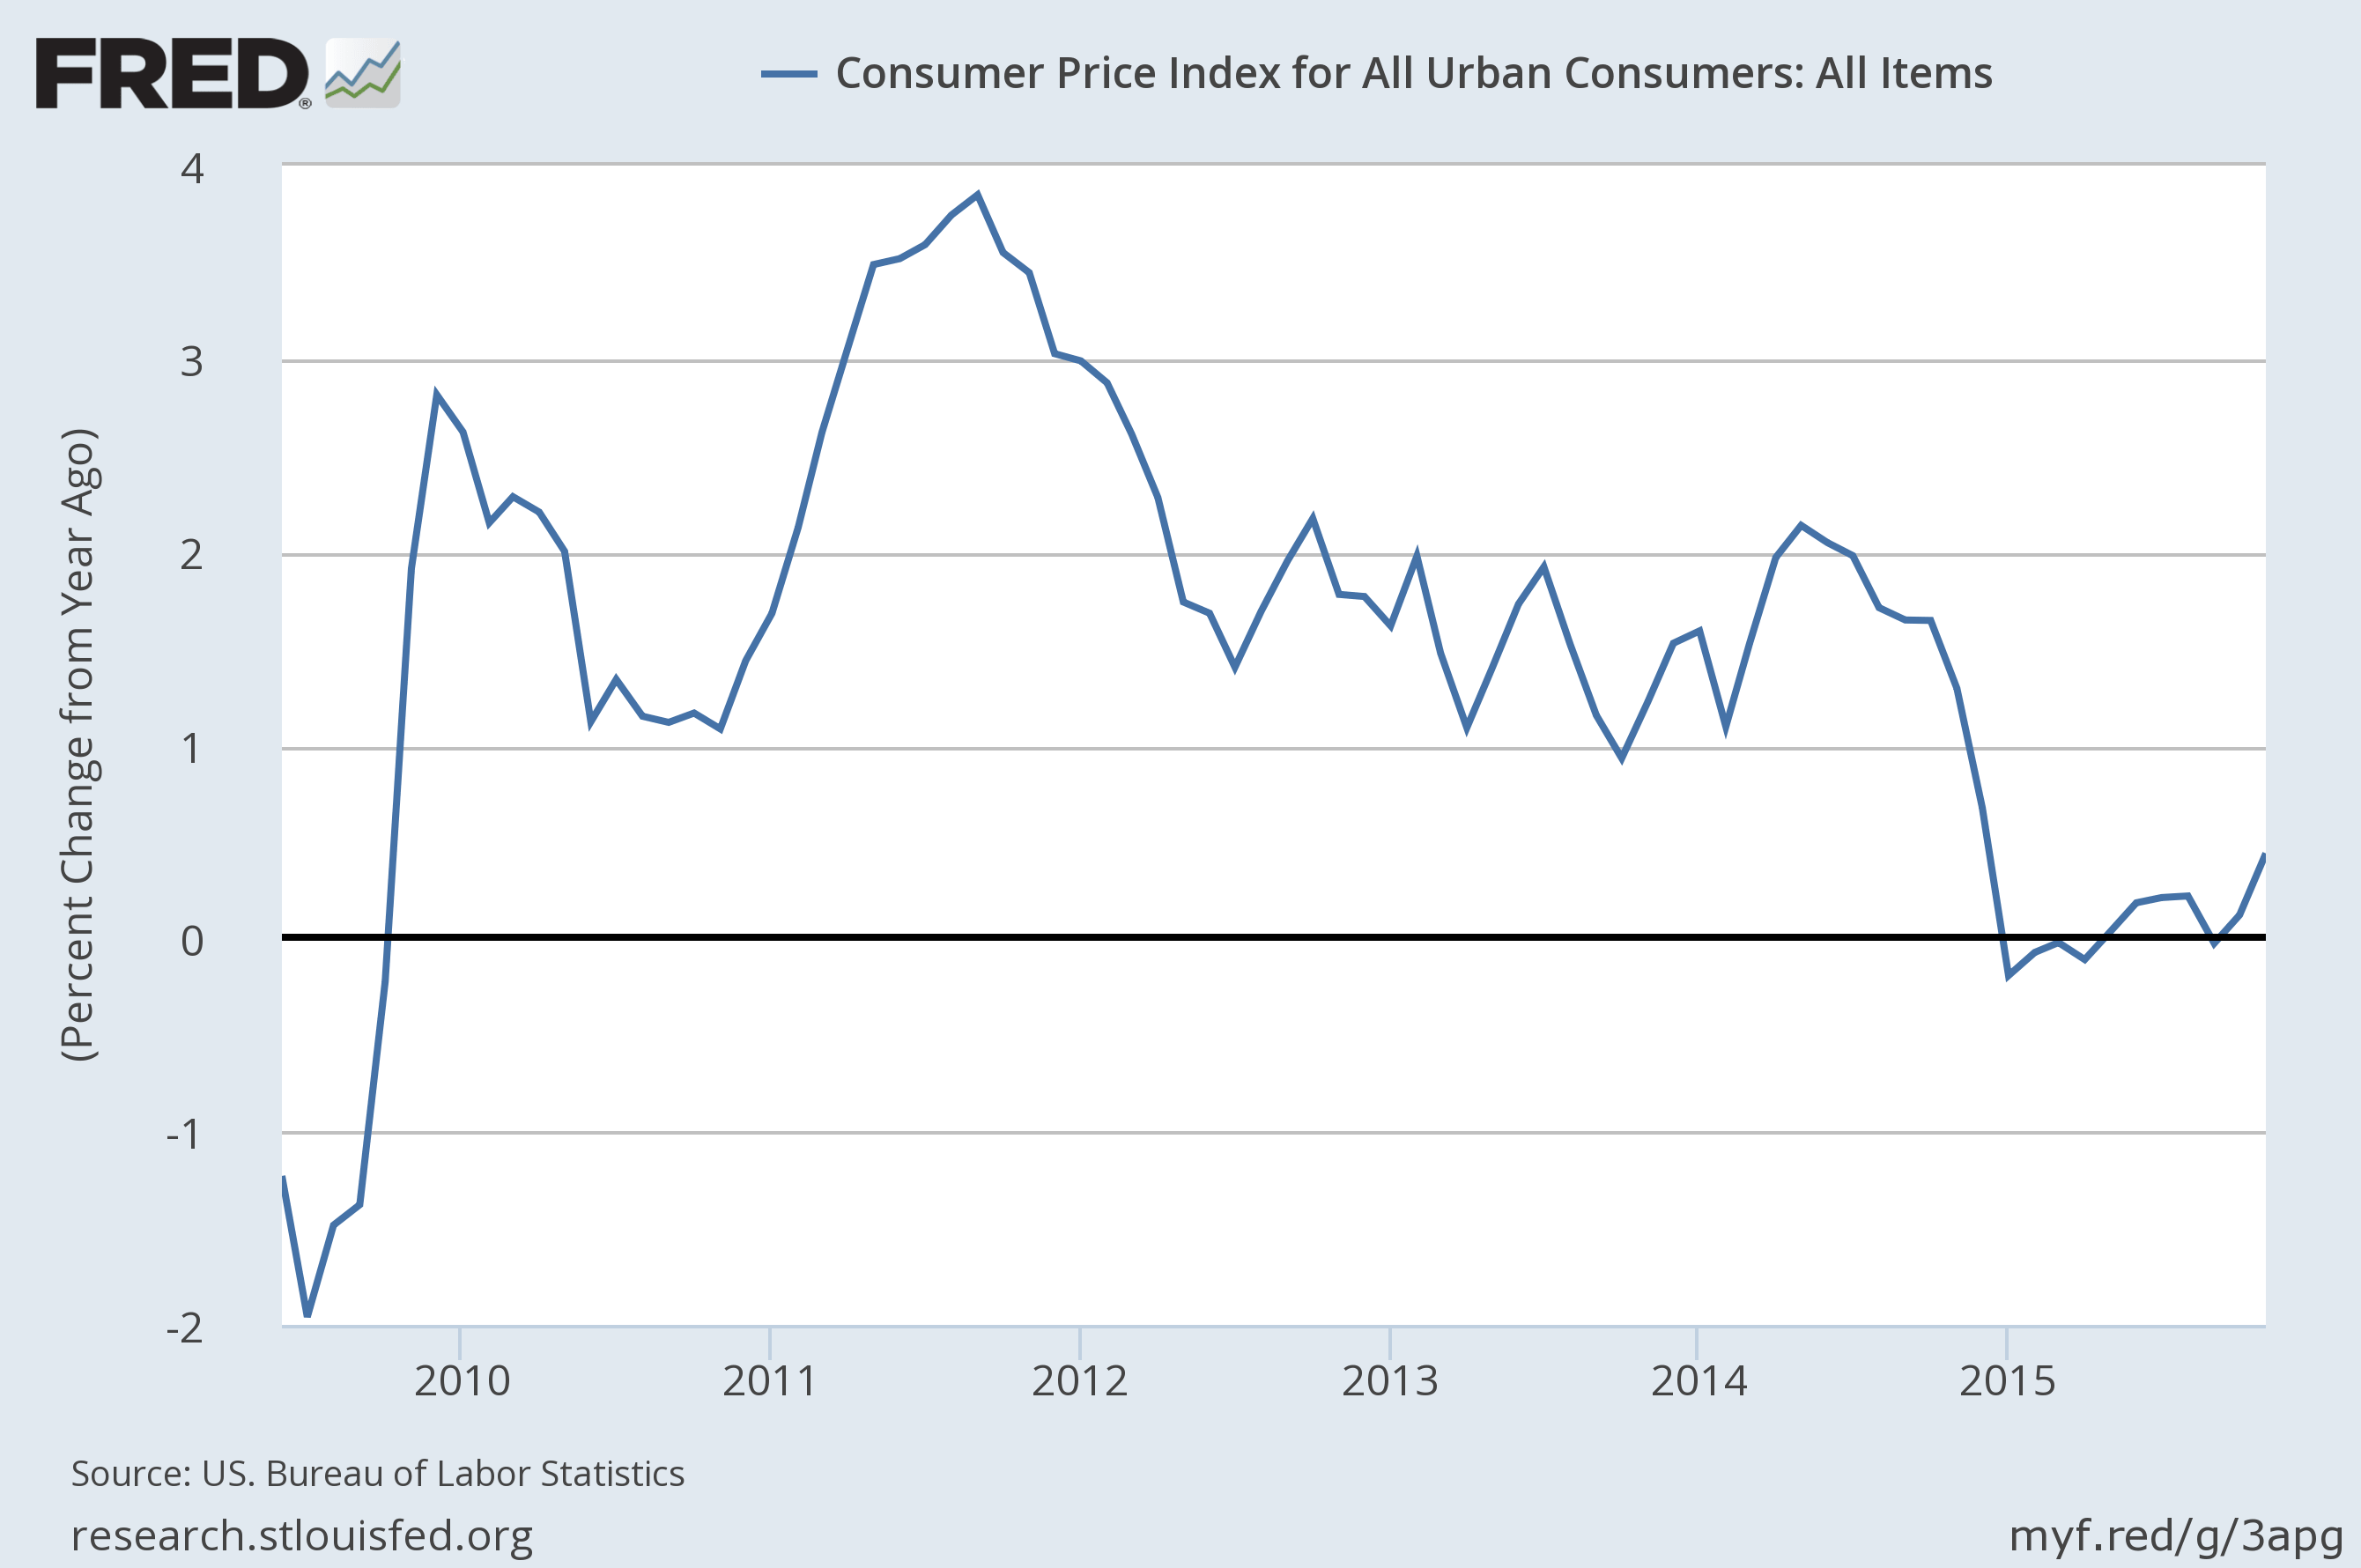
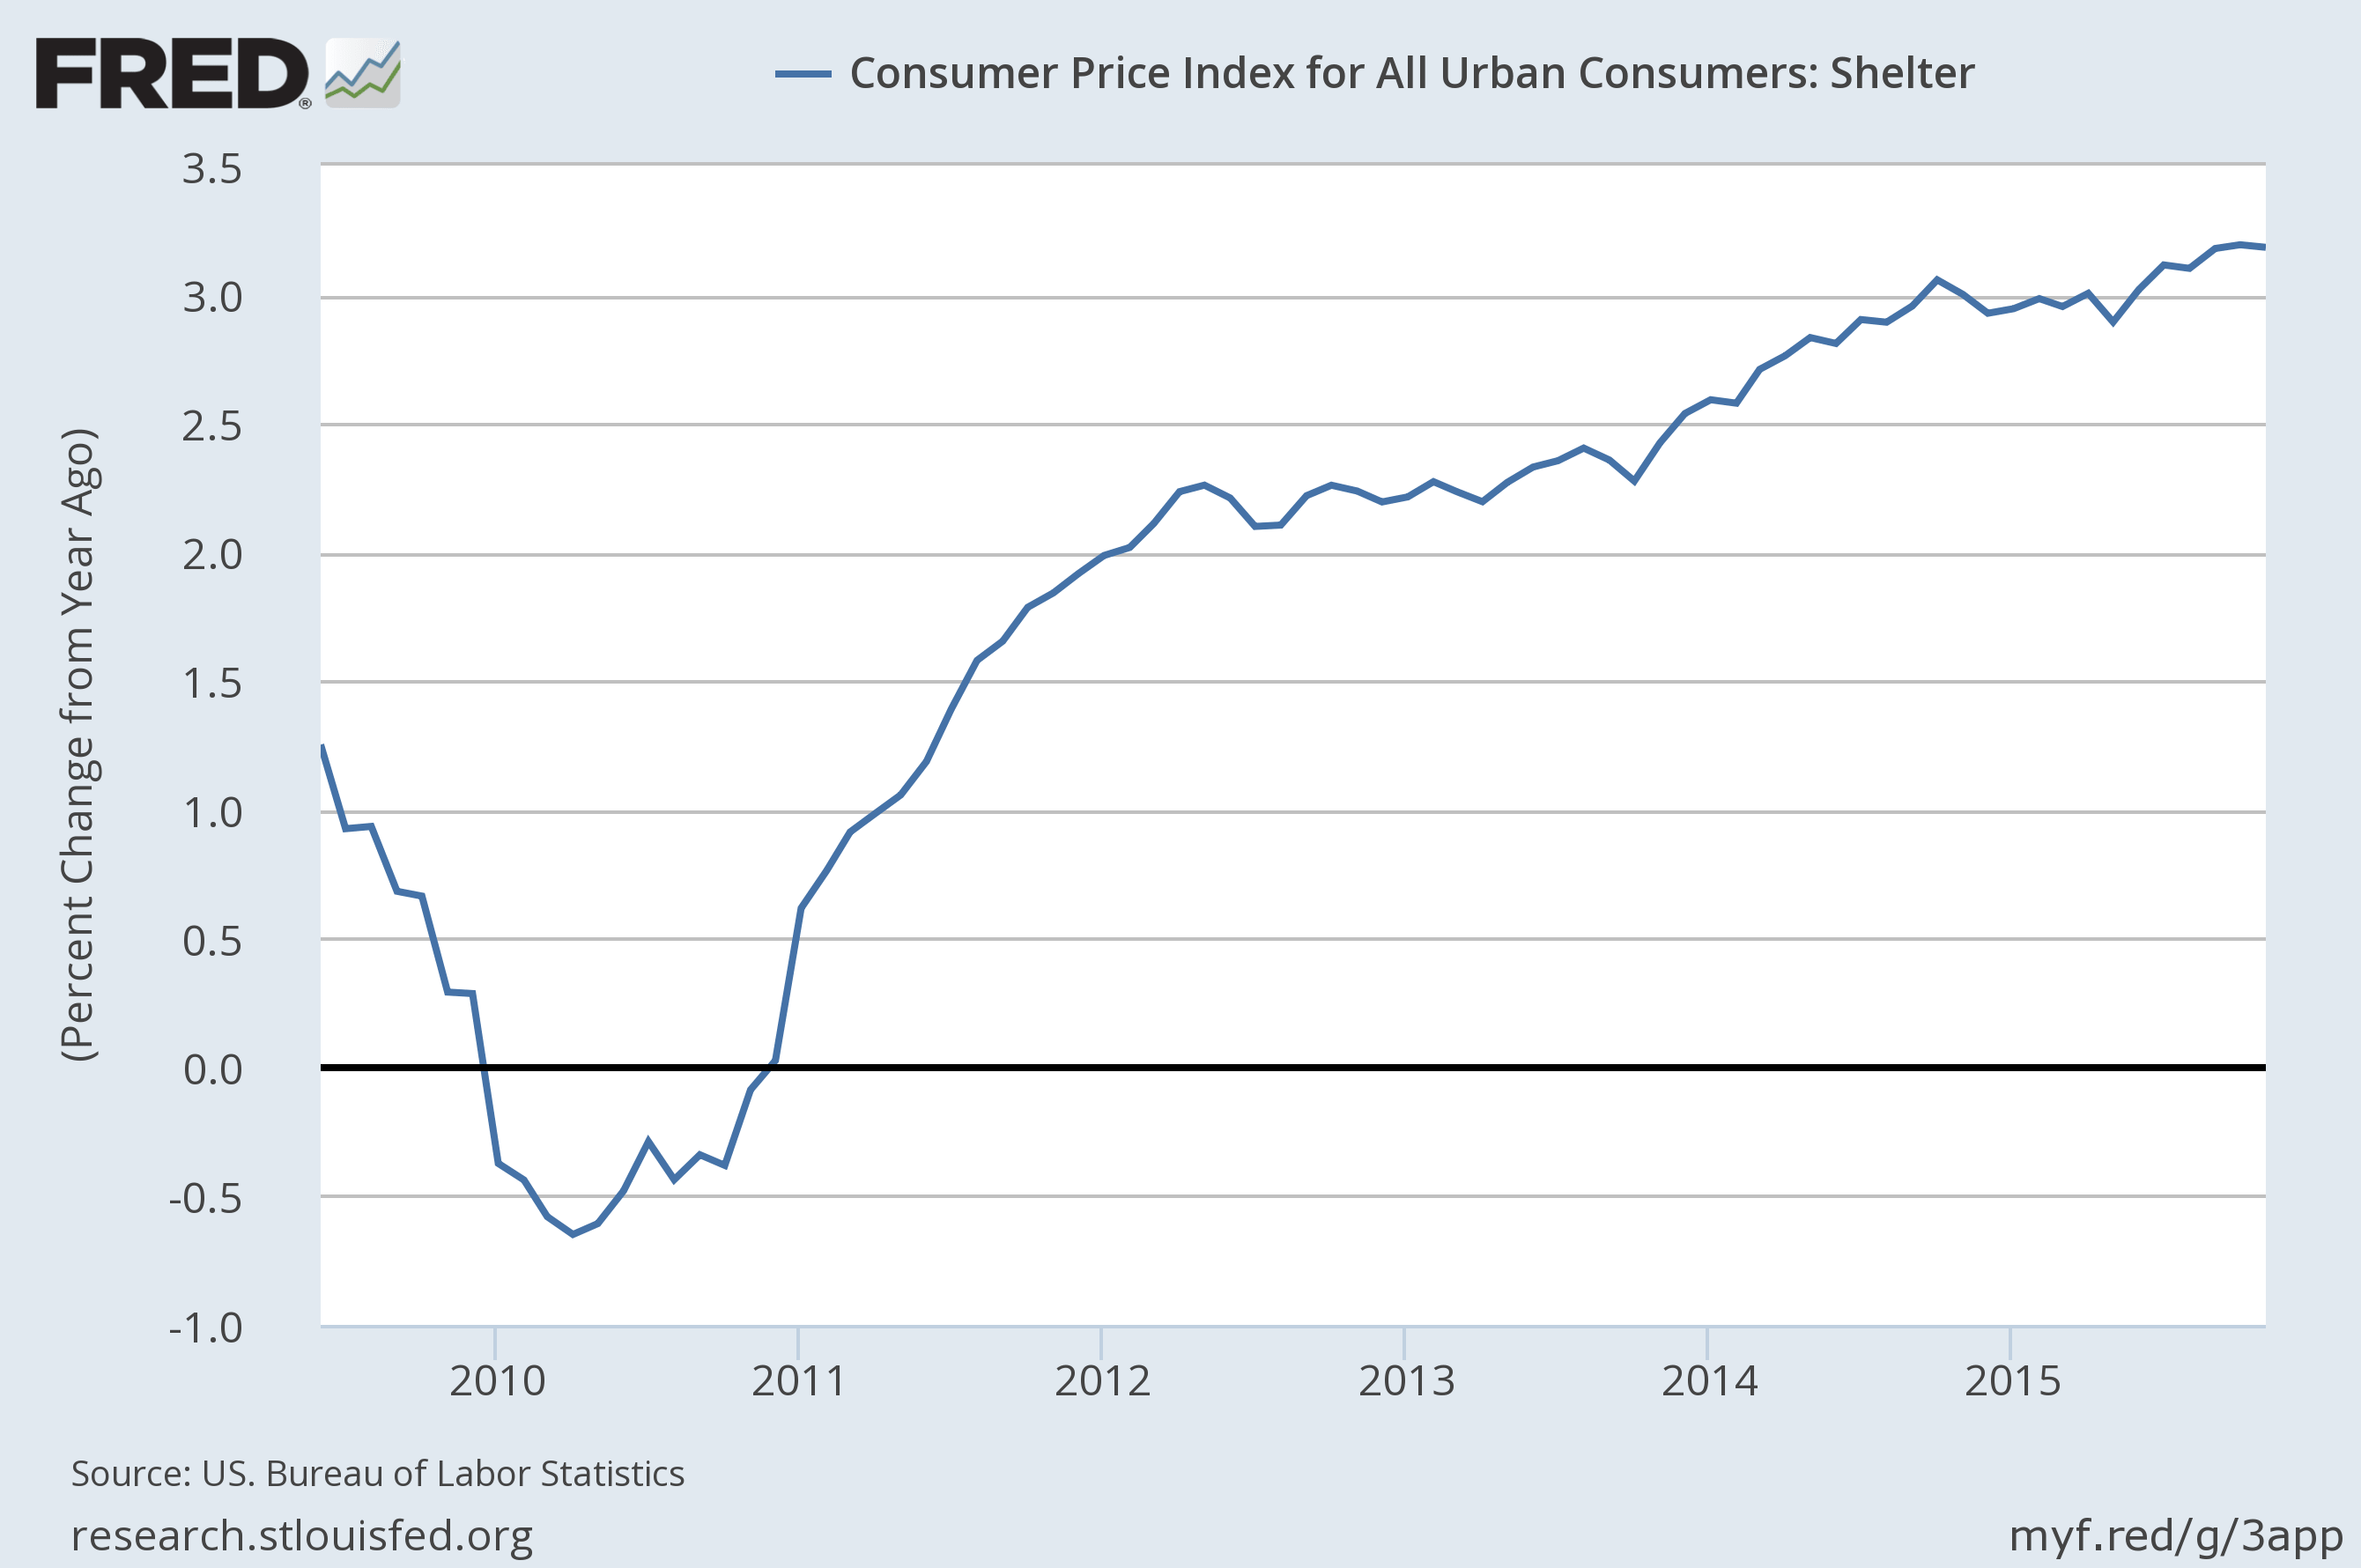
Unfortunately, I don't understand how we get broad inflation, by which I mean simultaneous consumer price inflation and wage inflation.  It makes sense to me that the Fed, by lowering interest rates, can push asset prices higher and provide corporations and borrowers an incentive to refinance debt thereby improving balance sheets and increasing cash flows.  It also makes sense to me how this could put upward pressure on consumer prices in multiple ways including marginally lowering the value of the dollar and increasing costs for imported goods.  And of course lower interest rates make saving less attractive and consumption (theoretically) more attractive.  In our current economic environment there is also growing pressure on rents which make up a large portion of consumer price inflation measures.  This, however, seems more to do with an increase of rental demand after a housing bust more than anything else.  I also understand that these are only a subset of the numerous other mechanisms through which lower interest rates support the general price level.</p>
<p>What I really don't get is how increased inflation supports wage inflation <i>as directly</i>, specifically employment income.  Income from investment, sure, that makes sense.  With lower interest rates supporting higher asset prices and refinancing activity decreasing debt finance costs, the mechanism here seems pretty direct.  But how does this translate to support for income earners whose primary income derives from labor?  That seems far less straight forward.</p>
<p>Given their improved balance sheets, employers will likely have increased room to hire if demand picks up.  But to the extent that demand is dependent on consumption (and it is significantly dependent on it in America today), it seems we have a chicken or the egg type problem.  Until income grows, demand is unlikely to grow.  But until demand grows, income is unlikely to grow.  Will consumption really be meaningfully stimulated for people with low savings and debts that were too large to begin with?  Should it be?  And with a relatively <a href="http://www.deptofnumbers.com/unemployment/us">high unemployment rate</a>, average wages per employee are not going to see significant pressure to rise either (though clearly, growing employment increases aggregate income even at a constant wage level).</p>
<p>I don't know how to quantify this, but my sense is that the median income derived from capital across all people earning an income from labor is small.  Another way of saying that is that I think most people in the labor force don't have significant investment income.  So I'm guessing that income from capital will not be a huge stimulus for the large majority of the labor force.  Perhaps aggregate income will increase inline with inflation; that is, total personal income in nominal terms will grow at or above the rate of general inflation.  But will income derived solely from labor grow at that rate?</p>
<p>
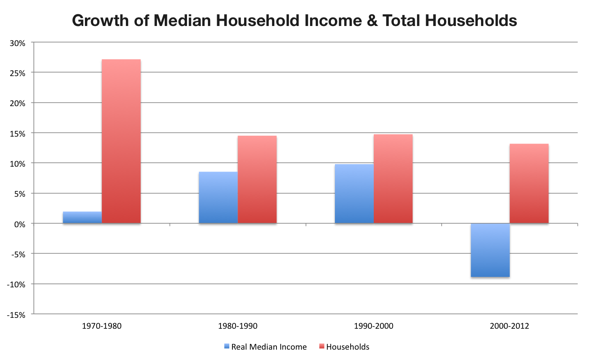
I'm curious about this because we've seen the best measure of the middle of the income distribution, real median household income, decline over the last couple of years.  So are these folks falling behind in real terms because monetary policy has a less direct (or perhaps slower) impact on wages?  That the <a href="http://deptofnumbers.com/income/us">median household income in the US</a> declined by 6.2% from 2007 to 2010 suggests that they at least <i>were</i> falling behind up to that point.  Will they catch up?</p>
<p>
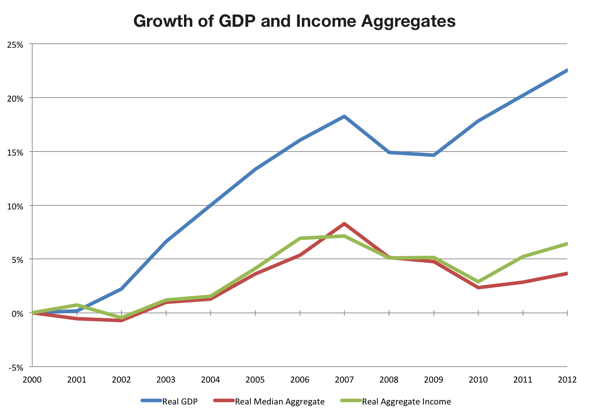
Unfortunately, median household income numbers are published only annually and with a considerable lag (the current data only goes through 2010).  In order to try to get a glimpse of recent trends for both total income and labor income versus inflation I offer the following chart.</p>
<p><b>Inflation vs. Employment Income and Personal Income since 2007</b></p>
<img src="http://www.deptofnumbers.com/blog/2012/05/2007.png" />
<p>
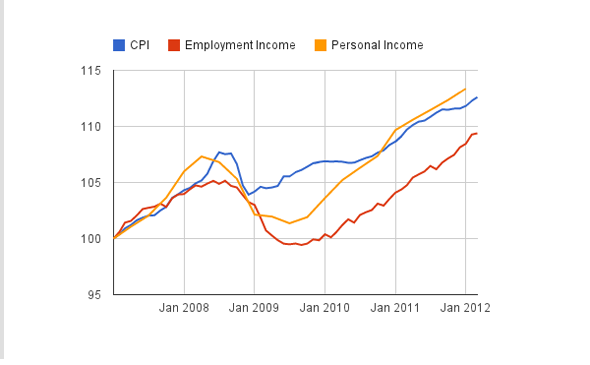
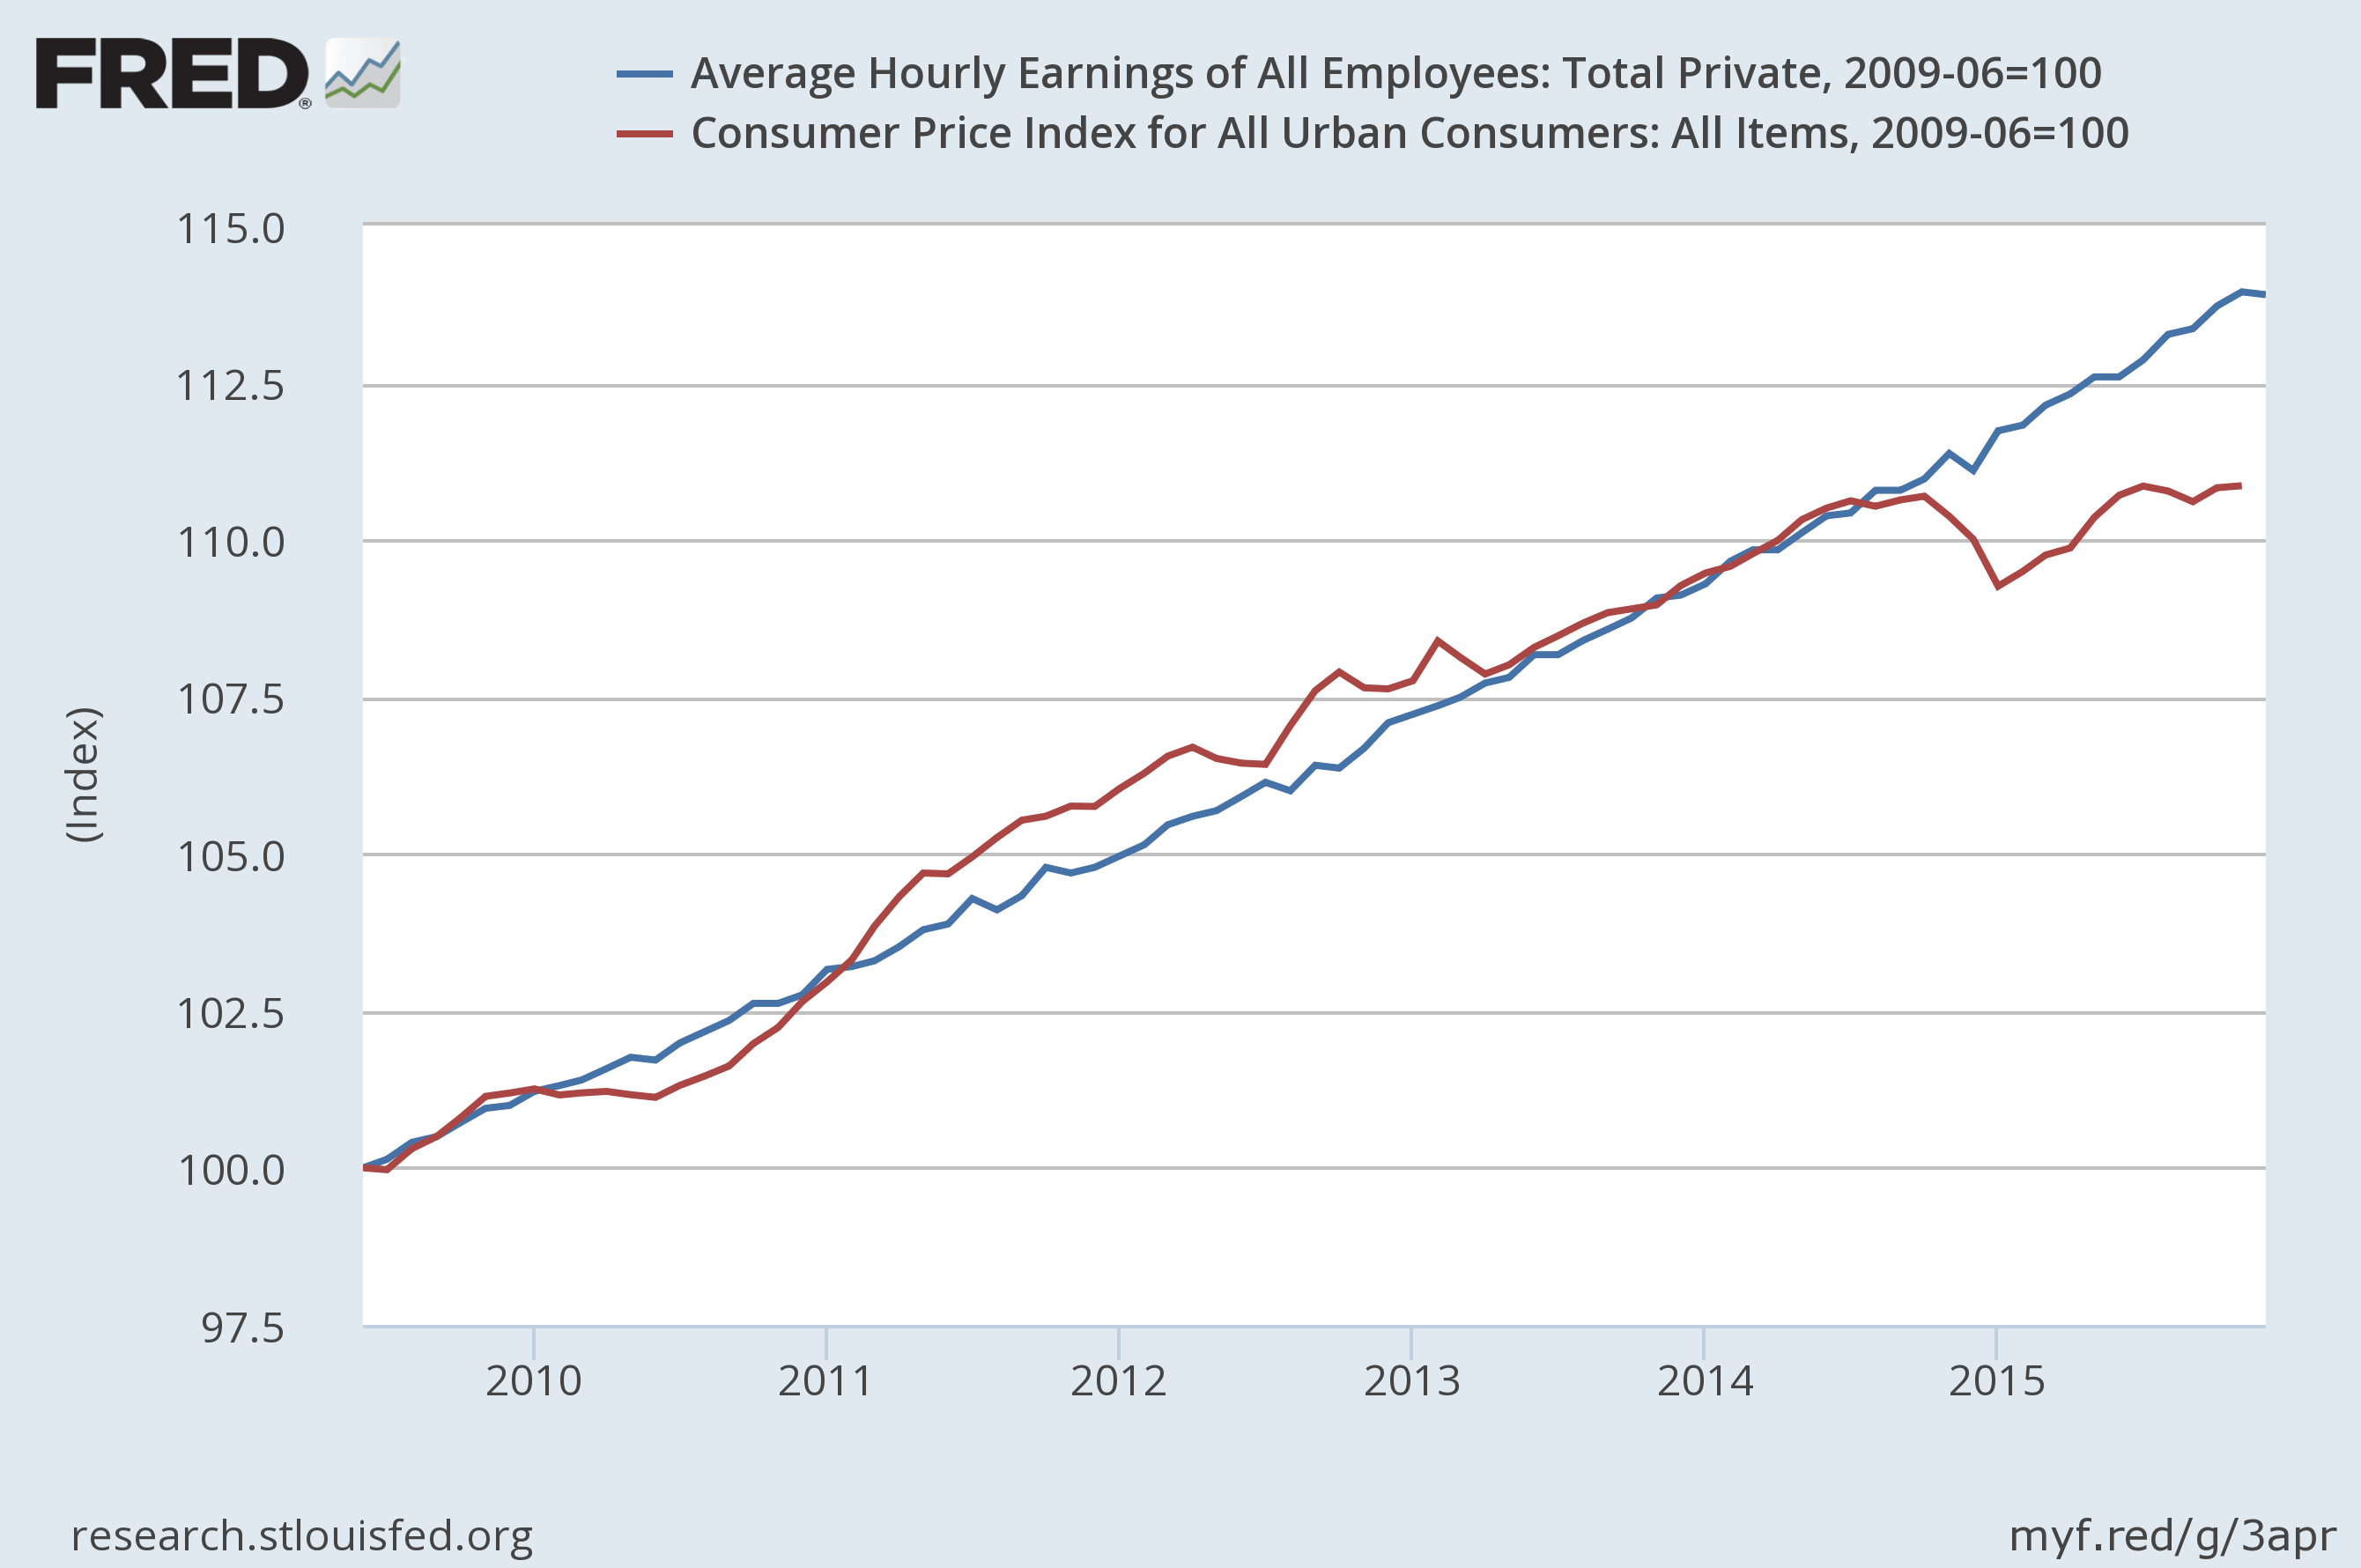
The two income lines on the above chart are in nominal terms and indexed to 100 in January 2007.  Along with the two measures of income, I also show consumer price (<a href="http://research.stlouisfed.org/fred2/series/CPIAUCSL">CPI-U</a>) changes.  The first income measure is <a href="http://research.stlouisfed.org/fred2/series/PINCOME">Personal Income</a>, all income for all persons from all sources &mdash;  a pretty complete measure I would say.  The second measure of income is what I call Total Employment Income.  I define that to be (<a href="http://research.stlouisfed.org/fred2/series/CES0500000003">Average Hourly Earnings of All Private Employees</a>) X (<a href="http://research.stlouisfed.org/fred2/series/AWHAETP">Average Weekly Hours of All Private Employees</a>) X (<a href="http://research.stlouisfed.org/fred2/series/NPPTTL">Total Nonfarm Private Payroll Employment</a>).  It's my attempt to measure employment income separate from other sources of income.  If anyone knows a better or more direct measure, please let me know.</p>
<p>The chart confirms to me what the median household income trends show, that middle income earners have fallen behind relative to inflation because of the recession.  While Personal Income has kept up and now exceeds inflation growth since 2007, Total Employment Income still has some distance to make up. In short, I can now make the exceedingly dumb observation that the recession hurt the real income of the average labor force participant.</p>
<p>But on a potentially positive note, if you re-index the three series to the technical end of the recession (June 2009), it looks like employment income is doing better than inflation to date (although not as good as Personal Income).</p>
<p><b>Inflation vs. Employment Income and Personal Income since the end of the Recession</b></p>
<img src="http://www.deptofnumbers.com/blog/2012/05/2009.png" />
<p>
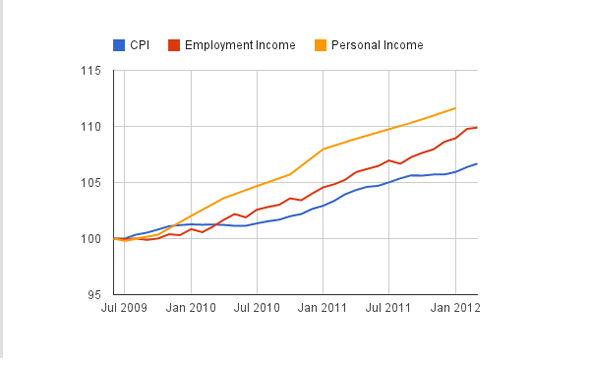
So perhaps the median household income measure for 2011 will reveal the  bottom for this cycle was in 2010 and households will gain on real basis when 2011 statistics are released.  If that's the case, I won't argue too much with the temporary pursuit of modestly higher inflation.  I may not understand all of its mechanisms, but as long as inflation affects wages as well as consumer prices I am comfortable with it.</p>
]]>
</content>
  </entry>
  <entry>
    <title>Miscellaneous Updates</title>
    <link rel="alternate" type="text/html" href="http://www.deptofnumbers.com/blog/2012/03/misc-updates" />
    <id>tag:www.deptofnumbers.com:2012-03-19:/blog/2012/03/misc-updates</id>
    <published>2012-03-19T09:01:21-07:00</published>
    <author>
      <name>Ben Engebreth</name>
      <uri>http://www.deptofnumbers.com</uri>
    </author>
    <updated>2012-03-19T09:01:21-07:00</updated>
    <content type="html" xml:lang="en" xml:base="http://www.deptofnumbers.com">
      <![CDATA[ <p>It's been a while since I've done a roundup of site changes here on the blog.  While things can sometimes appear quiet on the surface, I'm usually working on refining existing pages on the site or introducing new ones.  Within the last couple of months there have been some enhancements that you might have missed.</p>
<p>First off, I've started using the BLS' new <a href="http://www.bls.gov/lau/metrossa.htm">Smooth Seasonally Adjusted metro area estimates</a> for <a href="http://www.deptofnumbers.com/unemployment/metros/">metro unemployment data</a>. This is nice because it allows us to compare metro unemployment rates to <a href="http://www.deptofnumbers.com/unemployment/us/">national</a> and <a href="http://www.deptofnumbers.com/unemployment/states/">state unemployment rates</a> as well as to each other.  Previously the metro data was distributed solely in a non-seasonally adjusted form which made anything but year-over-year comparisons difficult.</p>
<p>In addition to the new unemployment data, I've also updated the income section of the site.  I'm now using the <a href="http://www.census.gov/acs/www/">American Community Survey's</a> 1-year data to report <a href="http://www.deptofnumbers.com/income/">real median household income</a> (and soon other income metrics) for metros, states and the nation as a whole.  Combined with the <a href="http://www.deptofnumbers.com/unemployment/metros/">metro unemployment</a> and <a href="http://www.deptofnumbers.com/employment/metros">metro jobs data</a>, I think this relatively new ACS data will be extremely telling as we observe the recovery from a local and household-based perspective.</p>
]]>
</content>
  </entry>
  <entry>
    <title>Asking Prices Go Positive Year/Year</title>
    <link rel="alternate" type="text/html" href="http://www.deptofnumbers.com/blog/2012/02/asking-prices-go-positive" />
    <id>tag:www.deptofnumbers.com:2012-02-01:/blog/2012/02/asking-prices-go-positive</id>
    <published>2012-02-01T15:01:31-08:00</published>
    <author>
      <name>Ben Engebreth</name>
      <uri>http://www.deptofnumbers.com</uri>
    </author>
    <updated>2012-02-01T15:01:31-08:00</updated>
    <content type="html" xml:lang="en" xml:base="http://www.deptofnumbers.com">
      <![CDATA[ <p>I was reminded by <a href="http://wallstreetexaminer.com/2012/01/31/the-trouble-with-case-shiller-again/">Lee's post on the Case-Shiller numbers</a> (and their inherent lag) to post something about <a href="http://www.deptofnumbers.com/asking-prices/us/">Y/Y asking prices going positive</a> for the first time since I've been keeping track of that data (early 2006).  Actually, the Y/Y median price went positive in December (as the <a href="http://bonddad.blogspot.com/2011/12/weekly-indicators-asking-prices-for.html">Bondad Blog immediately pointed out</a>), but I wanted to see January's data follow suit lest I prematurely announce a sign change only to have it reverse direction the following month.  Of course there's nothing that precludes that even with two months of positive Y/Y numbers, but it does tell me that the housing market is slowly healing itself.  The Y/Y inventory decline of roughly 15% (which puts it at an all time low for the series) offers additional supporting evidence.  That's not to say that we'll be returning to rapid price appreciation any time soon; I certainly don't foresee that.  But I try not to make predictions, just observations.  And the relative uniqueness of this observation seems worth noting.</p>
<p><b>Update:</b> More commentary on inventory and asking price levels <a href="http://www.calculatedriskblog.com/2012/03/existing-home-inventory-declines-21.html">here</a>, <a href="http://www.calculatedriskblog.com/2012/03/housing-year-over-year-change-in-asking.html">here</a> and <a href="http://bonddad.blogspot.com/2012/03/are-home-sellers-being-reasonable-about.html">here</a>.</p>

<p><b>25th, Median (50th) and 75th Percentile Asking Prices for US Homes</b></p>
<img src="http://www.deptofnumbers.com/blog/2012/02/asking-prices.png" />

<p><b>US Home Inventory</b></p>
<img src="http://www.deptofnumbers.com/blog/2012/02/inventory.png" />
]]>
</content>
  </entry>
  <entry>
    <title>US Manufacturing: Output Growth, Employment Decline</title>
    <link rel="alternate" type="text/html" href="http://www.deptofnumbers.com/blog/2012/01/us-manufacturing-output-growth-employment-decline" />
    <id>tag:www.deptofnumbers.com:2012-01-12:/blog/2012/01/us-manufacturing-output-growth-employment-decline</id>
    <published>2012-01-12T21:13:02-08:00</published>
    <author>
      <name>Ben Engebreth</name>
      <uri>http://www.deptofnumbers.com</uri>
    </author>
    <updated>2012-01-12T21:13:02-08:00</updated>
    <content type="html" xml:lang="en" xml:base="http://www.deptofnumbers.com">
      <![CDATA[ <p>Adam Davidson (of Planet Money fame) has an excellent <a href="http://www.theatlantic.com/magazine/archive/2012/01/making-it-in-america/8844/?single_page=true">piece on manufacturing in the Atlantic</a> this month.</a>  In it he does a superb job of illuminating the shifting landscape for manufacturing employees in modern factories.  The piece is strong precisely because it's not primarily about aggregate numbers but individual experiences.  Take a break and read the whole thing.  The latest Planet Money podcast (<a href="http://www.npr.org/blogs/money/2012/01/10/144978487/the-tuesday-podcast-the-past-and-future-of-american-manufacturing?ps=cprs">The Past and Future of American Manufacturing</a>) covers the same topic.  If you needed a couple of charts to accompany the presentation, I whipped up a few.  But don't neglect the story of the individual.  The charts below are <a href="http://www.deptofnumbers.com/blog/2012/01/us-manufacturing-output-growth-employment-decline#manufacturing_shipments">US Manufacturers' Annual Shipments</a>, <a href="http://www.deptofnumbers.com/blog/2012/01/us-manufacturing-output-growth-employment-decline#manufacturing_employment">US Manufacturing Employment</a> and <a href="http://www.deptofnumbers.com/blog/2012/01/us-manufacturing-output-growth-employment-decline#shipments_per_employee">Annual Manufacturers' Shipments per Employee</a> respectively.</p> 
<img src="http://www.deptofnumbers.com/blog/2012/01/manufacturing_shipments.png" />
<img src="http://www.deptofnumbers.com/blog/2012/01/manufacturing_employment.png" />
<img src="http://www.deptofnumbers.com/blog/2012/01/shipments_per_employee.png" />
<p><b>Sources:</b> Manufacturers' Annual Shipments comes from the <a href="http://www.census.gov/manufacturing/m3/">Census' M3 report</a>, manufacturing employment is from the <a href="http://www.bls.gov/iag/tgs/iag31-33.htm#workforce">BLS</a>.  Inflation adjustments made using the <a href="http://research.stlouisfed.org/fred2/series/GDPDEF">GDP implicit price deflator</a>.</p>
]]>
</content>
  </entry>
  <entry>
    <title>R&amp;D Spending by the Federal Government</title>
    <link rel="alternate" type="text/html" href="http://www.deptofnumbers.com/blog/2012/01/rd-spending-by-federal-gov" />
    <id>tag:www.deptofnumbers.com:2012-01-02:/blog/2012/01/rd-spending-by-federal-gov</id>
    <published>2012-01-02T15:21:35-08:00</published>
    <author>
      <name>Ben Engebreth</name>
      <uri>http://www.deptofnumbers.com</uri>
    </author>
    <updated>2012-01-02T15:21:35-08:00</updated>
    <content type="html" xml:lang="en" xml:base="http://www.deptofnumbers.com">
      <![CDATA[ <p>Let me start by saying that this post is more like the beginnings of an exploration rather than something I am trying to draw conclusions with.  My interests are the historical role that the government has played in funding research and development in the United States, the scale of those programs relative to overall government expenditures, and the potential for additional funding sources to complement and enhance funding for R&D in the future.  I'm just trying to document these explorations a little.  The data in the post comes from the <a href="http://www.whitehouse.gov/omb/budget/Historicals">OMB Historical budget tables</a>, specifically <a href="http://www.whitehouse.gov/sites/default/files/omb/budget/fy2012/assets/hist09z7.xls">Table 9.7 (xls)</a> and <a href="http://www.whitehouse.gov/sites/default/files/omb/budget/fy2012/assets/hist09z8.xls">Table 9.8 (xls)</a>.</p>  
<p>The first chart shows the fraction of US government outlays (i.e. spending) that went to defense and non-defense research and development.  The 1960s peak coincides with the Cold War Space Race that culminated with the Apollo program moon landing, a feat not repeated by humanity for 39 years now (<a href="http://www.nytimes.com/2011/12/30/world/asia/china-unveils-ambitious-plan-to-explore-space.html?pagewanted=all">not that China isn't working toward this goal as we speak</a>).  Both defense and non-defense spending have flattened out since then as a fraction of outlays.</p>
<img src="http://www.deptofnumbers.com/blog/2012/01/rd_sm.png" />
<p>The next chart breaks out funding for three Federal research agencies that operate in the non-defense category. The value is again expressed as a fraction of total Federal outlays.  Anyone who has spent time in the academic world knows how critical grants from institutions like the <a href="http://nsf.gov/">NSF</a>, <a href="http://www.nasa.gov">NASA</a> and <a href="http://www.nih.gov/">NIH</a> are to funding day-to-day research operations.</p>
<img src="http://www.deptofnumbers.com/blog/2012/01/rd_institution_sm.png" />
<p>But perhaps looking at R&D spending as a fraction of total government spending is a bit misleading.  As the country has developed over the last 60 years, we've instituted new programs and created new agencies which have increased our <a href="http://www.deptofnumbers.com/blog/2011/02/gov-expenditures-gdp-fraction/">total expenditures</a>.  In reality R&D spending has been growing; it just hasn't been growing as fast as many other components of government spending.  The next chart shows the R&D spending in 2005 constant (i.e. real, inflation adjusted) dollars.</p>  
<img src="http://www.deptofnumbers.com/blog/2012/01/rd_dollars_sm.png" />
<p>Indeed, non-defense R&D spending was 40% higher in 2011 than 2001 on a real basis, but dipped slightly over the same period when expressed in terms of total government spending.  So we continue to spend more and more money on research, it's just that we spend even more on other parts of government.</p>
<p>My real interest here isn't to critique the amounts we've been spending but instead goes back to that idea that <a href="http://marginalrevolution.com/">Tyler Cowen</a> put forth in the Great Stagnation, that is, to "raise the social status of scientists."  Admittedly, status goes beyond financial considerations and includes a significant cultural component, but these (and other) research agencies help confer status to US scientists to the extent we define status as funding and employment within the scientist's field of expertise.  We haven't done a bad job of things so far, but what could we accomplish if we were to increase funding to these agencies?  What might we have already accomplished had that increase started 10, 15 or 20 years back?  Can we reasonably expect that spending more in this category would yield positive results over the long term?  Would it help foster a cultural appreciation of science and scientists?</p>
<p>With the sluggish economy and political deadlock in Washington, I doubt that we'll see significant increases in funding going to research and development organizations in the coming years &mdash; at least not from the Federal government.  But I wonder if there isn't a way to leverage the institutions that we've already created.  Can we build public/private partnerships that channel <i>additional</i> financial resources into the agencies we've already built?  If so, would this be a wise thing to do?</p>
]]>
</content>
  </entry>
  <entry>
    <title>Fraction of Unemployed Receiving Unemployment Benefits</title>
    <link rel="alternate" type="text/html" href="http://www.deptofnumbers.com/blog/2011/10/fraction-of-unemployed-receiving-unemployment-benefits" />
    <id>tag:www.deptofnumbers.com:2011-10-03:/blog/2011/10/fraction-of-unemployed-receiving-unemployment-benefits</id>
    <published>2011-10-03T16:17:32-07:00</published>
    <author>
      <name>Ben Engebreth</name>
      <uri>http://www.deptofnumbers.com</uri>
    </author>
    <updated>2011-10-03T16:17:32-07:00</updated>
    <content type="html" xml:lang="en" xml:base="http://www.deptofnumbers.com">
      <![CDATA[ <p>How many unemployed persons receive unemployment benefits?  It's a question I couldn't immediately answer, so I poked around the <a href="http://www.dol.gov/">Department of Labor's website</a> until I found the relevent data.  The chart below tells us that about 60% of the unemployed were receiving unemployment benefits in August 2011 on a rolling 12-month basis (to remove seasonal effects).  The benefits data is from a DOL <a href="http://ows.doleta.gov/unemploy/docs/persons.xls">spreadsheet that compiles unemployment benefits data across all programs [ xls ]</a>.  The number of unemployed persons is from the <a href="http://research.stlouisfed.org/fred2/series/LNU03000000">unadjusted unemployment level data</a> published as part of the <a href="http://www.bls.gov/cps/">BLS Current Population Survey</a>.</p>
<img alt="fraction of unemployed who receive unemployment benefits" src="http://www.deptofnumbers.com/blog/2011/10/unemployment_benefit_fraction.png" />
<p>The chart is also a good reminder that not all unemployed persons can claim unemployment benefits.  Of the <a href="http://www.deptofnumbers.com/unemployment/us">nearly 14 million unemployed</a> in August of 2011, a rough estimate suggests that around 5.6 million were not receiving benefits (it's rough because I'm estimating from a moving average which is inherently lagged).</p>  
<p>The unemployment insurance program is complex and evolving, but the <a href="http://www.cbpp.org/">Center on Budget and Policy Priorities</a> has an excellent <a href="http://www.cbpp.org/cms/index.cfm?fa=view&id=1466">overview of unemployment insurance</a> if you're interested in learning more about the mechanics of the program.</p>
]]>
</content>
  </entry>
  <entry>
    <title>A New Tool for Correlation Analysis</title>
    <link rel="alternate" type="text/html" href="http://www.deptofnumbers.com/blog/2011/09/correlation-tool" />
    <id>tag:www.deptofnumbers.com:2011-09-04:/blog/2011/09/correlation-tool</id>
    <published>2011-09-04T11:01:35-07:00</published>
    <author>
      <name>Ben Engebreth</name>
      <uri>http://www.deptofnumbers.com</uri>
    </author>
    <updated>2011-09-04T11:01:35-07:00</updated>
    <content type="html" xml:lang="en" xml:base="http://www.deptofnumbers.com">
      <![CDATA[ <p>Today I'm launching the <a href="http://www.deptofnumbers.com/correlator/">Department of Numbers Correlator</a>, a tool for analyzing the correlation coefficients of select ETFs tracking major asset classes.  Check out the results:</p>
<p><b>Correlator Results for the Period from 8/2007 to 9/2011 for Select ETFs</b></p>
<img src="http://www.deptofnumbers.com/blog/2011/09/Correlator-Example-Results.png" />
<img src="http://www.deptofnumbers.com/blog/2011/09/Correlator-Colorbar.png" />
<p>The chart above shows the correlation coefficients calculated from monthly returns of 9 ETFs representing the US equity market (VTI), foreign developed markets (VEA), emerging markets (VWO), US REITS (VNQ), TIPs (TIP), Gold (GLD), Cash (SHV), Intermediate-term Treasuries (IEF) and Long-term Treasuries (TLT). Right now the tool only has 13 <a href="http://www.deptofnumbers.com/correlator/tickers/">ETFs available for correlation analysis</a>, but I intend to add a good deal more after testing things out and hearing your suggestions (my contact info is at the bottom of the page!).  Something like <a href="http://www.mebanefaber.com/2011/03/18/what-worked/">Mebane Faber's "expanded list" of asset classes</a> would seem like a good next step.</p>
<p>So what is this correlation coefficient business?  In layman's terms, the correlation coefficient describes how the returns for different assets move with respect to one another.  A correlation coefficient of 1.0 implies that two assets tend to move in the same direction (though not necessarily in steps of equal magnitude).  A -1.0 correlation value suggests that they move in opposite directions.  Correlation values of 1.0 or -1.0 are unheard of however.  What you see in reality are evolving correlations that range between -1.0 and 1.0 suggesting imperfect  interrelationships where one asset tends to move with another (correlation &gt; 0) or against another asset (correlation &lt; 0) to a moderate degree.</p>
<p>I should also point out that I built this tool with <a href="http://www.r-project.org/">R</a> which enables this neat clustering option (enabled above) that groups like assets.  For instance, VTI, VEA and VWO are all pretty similar qualitatively (they're relatively highly correlated because they're all larger cap equities).  The clustering recognizes this in a quantitative manner and groups these three tickers together when creating the chart.  For similar reasons IEF and TLT are placed next to one another as well as TIP and GLD.  For much more on the clustering method see the R documentation for <a href="http://stat.ethz.ch/R-manual/R-devel/library/stats/html/hclust.html">hierarchical clustering</a>.</p>
<p>Go try out the correlator yourself <a href="http://www.deptofnumbers.com/correlator">here</a>!</p>
<p><b>Update 1:</b> I added a bunch more <a href="http://www.deptofnumbers.com/correlator/tickers/">tickers</a>.</p>
<p><b>Update 2:</b> I changed the correlator's methodology (sorry, it's still a beta project folks).  I had previously been including dividends in the correlation calculations.  Other <a href="http://www.sectorspdr.com/correlation/">correlation tools</a> on the web do <i>not</i> do this, so I've decided to remove dividends from the calculation for the time being for consistency sake.  I'll add them back in as an option later.  The chart above has been updated.</p>
<p><b>Update 3:</b> More changes!  Sorry folks...  While the correlation tool previously agreed with the S&P sector tool I referenced in the last update, it turns out that's not really a metric that I want to agree with!  The S&P site seems to be using correlation of prices rather than correlation of returns &mdash; at least that's what I infer from the results.  I think investors are more interested in the correlation of returns (including dividends).  I'll lay this all out in a new post eventually, and I'll try to stop flip-flopping so much.</p>
]]>
</content>
  </entry>
  <entry>
    <title>Revenue, Expenses, Debts and Deficits</title>
    <link rel="alternate" type="text/html" href="http://www.deptofnumbers.com/blog/2011/07/revenue-expenses-debts-and-deficits" />
    <id>tag:www.deptofnumbers.com:2011-07-18:/blog/2011/07/revenue-expenses-debts-and-deficits</id>
    <published>2011-07-18T10:00:51-07:00</published>
    <author>
      <name>Ben Engebreth</name>
      <uri>http://www.deptofnumbers.com</uri>
    </author>
    <updated>2011-07-18T10:00:51-07:00</updated>
    <content type="html" xml:lang="en" xml:base="http://www.deptofnumbers.com">
      <![CDATA[ <p>All the debt ceiling talk has focused the minds of bloggers and analysts everywhere it seems.  Over the weekend I decided to add a new page to the site that shows a continually <a href="http://www.deptofnumbers.com/misc/debt-revenue-and-expenditures-as-a-fraction-of-gdp/">up-to-date record of the US federal debt, deficit, receipts and expenses as a fraction of GDP</a>.  The page is an update to two popular posts I put together outlining government <a href="http://www.deptofnumbers.com/blog/2010/08/tax-revenue-as-a-fraction-of-gdp">revenue</a> and <a href="http://www.deptofnumbers.com/blog/2011/02/gov-expenditures-gdp-fraction">expenditures</a>.  And I see that Calculated Risk was also drawn to the analysis of government receipts and outlays data over the weekend.  He put together an excellent post on the <a href="http://www.calculatedriskblog.com/2011/07/us-government-receipts-as-percent-of.html">components of government receipts</a> yesterday and it sounds like a version for outlays may be forthcoming.</p> 
<p>While the immediate motivation for these explorations (for me at least) is the looming deadline for raising the debt ceiling so that the US will avoid defaulting on its debt, it should be clear that the issue of debt and deficits (and thus taxes and spending) is not going away anytime soon.  This is an issue we'll be working through for many years, and I want to be able to keep track of our progress.  So then here are the current charts for US debt, receipts, expenditures, and budget deficits or surpluses all as a fraction of GDP.  The latest data (including updated versions of these charts) lives <a href="http://www.deptofnumbers.com/misc/debt-revenue-and-expenditures-as-a-fraction-of-gdp/">here</a>.</p>
<p><b>Total Federal Debt as a Fraction of GDP</b></p>
<img src="http://www.deptofnumbers.com/blog/2011/07/debt.png" />
<p><b>Government Receipts and Expenditures as a Fraction of GDP</b></p>
<img src="http://www.deptofnumbers.com/blog/2011/07/revenue-expenses.png" />
<p><b>Government Budget Surplus or Deficit as a Fraction of GDP: ( Receipts - Expenditures )</b></p>
<img src="http://www.deptofnumbers.com/blog/2011/07/deficit.png" />
]]>
</content>
  </entry>
  <entry>
    <title>Median Income Before and after Taxes</title>
    <link rel="alternate" type="text/html" href="http://www.deptofnumbers.com/blog/2011/07/median-income-before-and-after-taxes" />
    <id>tag:www.deptofnumbers.com:2011-07-05:/blog/2011/07/median-income-before-and-after-taxes</id>
    <published>2011-07-05T10:24:15-07:00</published>
    <author>
      <name>Ben Engebreth</name>
      <uri>http://www.deptofnumbers.com</uri>
    </author>
    <updated>2011-07-05T10:24:15-07:00</updated>
    <content type="html" xml:lang="en" xml:base="http://www.deptofnumbers.com">
      <![CDATA[ <p>At the beginning of his book <a href="http://www.amazon.com/Great-Stagnation-Low-Hanging-Eventually-ebook/dp/B004H0M8QS">The Great Stagnation</a>, <a href="http://marginalrevolution.com/">Tyler Cowen</a> presents a single chart that provides the central evidence for slowing growth in the standard of living for individuals and families that he will explore in the remaining pages.  That chart (below) shows where median family income would have been had we continued to see income growth roughly track per capita GDP growth.</p>
<img src="http://www.deptofnumbers.com/blog/2011/07/slowincomegrowth-figure2.png" />
<p>That chart of extrapolated income derives from the <a href="http://lanekenworthy.net/2008/09/03/slow-income-growth-for-middle-america/">chart below produced by Lane Kenworthy</a> showing median family income and per capita GDP series as indices.</p>
<img src="http://www.deptofnumbers.com/blog/2011/07/slowincomegrowth-figure1.png" />
<p>I've long wondered what median income would look like <i>after</i> taxes were taken into account and if the structure of Lane's chart might change given the dynamic nature of tax policy.  Bruce Bartlett's recent post on <a href="http://economix.blogs.nytimes.com/2011/06/21/are-taxes-high-or-low-a-further-look/">average tax rates for four-person families</a> pointed out the data I needed to make such a comparison.  The <a href="http://www.taxpolicycenter.org/">Tax Policy Center</a> produces <a href="http://www.taxpolicycenter.org/taxfacts/Content/PDF/family_inc_hist.pdf">annual average tax rates for four-person families at the median income level</a>.  Using their historical data I can back out the growth of after-tax median family income since 1980 (just after GDP per capita and median family income start to diverge) and add that data to the chart that Lane produced.</p>
<p><b>GDP per Capita, Real Median Family Income and Real Median Family Income After Taxes</b></p>
<img src="http://www.deptofnumbers.com/blog/2011/07/tax-adjusted-income.png" />
<p>The results, though not earth shattering, are interesting.  Prior to 2000, both real (i.e. inflation adjusted) median family income and real median family income after taxes grew at about the same rate.  Real median family income has actually declined since 2000, but when you look at after-tax dollars received by households it's been relatively flat.  In other words, the median family has been able to avoid a more substantial decline in income by paying somewhat less in taxes.  It's not a huge difference, but treading water certainly feels better than sinking.  And part of me wonders if this phenomenon doesn't play some small role in the toxic policy debate surrounding taxes.  If tax rates on the median family rise now, it's likely that the after-tax income of those families will fall from the plateau it has been riding along for the last decade.  If real median income were growing, however, I suspect there would be at least <i>somewhat</i> less resistance for increasing tax rates as it would only slow growth in after-tax income as opposed to causing its outright decline.</p>
]]>
</content>
  </entry>
  <entry>
    <title>Q1 2011 Housing Affordability Update &amp; Buy vs. Rent Analysis</title>
    <link rel="alternate" type="text/html" href="http://www.deptofnumbers.com/blog/2011/05/housing-affordability-update" />
    <id>tag:www.deptofnumbers.com:2011-05-11:/blog/2011/05/housing-affordability-update</id>
    <published>2011-05-11T11:16:35-07:00</published>
    <author>
      <name>Ben Engebreth</name>
      <uri>http://www.deptofnumbers.com</uri>
    </author>
    <updated>2011-05-11T11:16:35-07:00</updated>
    <content type="html" xml:lang="en" xml:base="http://www.deptofnumbers.com">
<![CDATA[ <script type="text/javascript" src="http://www.deptofnumbers.com/js/jquery.js">
</script>
<script type="text/javascript" src="http://www.deptofnumbers.com/js/jquery.tablesorter.js">
</script>
<script type="text/javascript" src="http://www.deptofnumbers.com/js/jquery.metadata.js">
</script>
<p><a href="http://www.nytimes.com/2011/05/11/business/economy/11leonhardt.html">David Leonhardt</a>, <a href="http://www.calculatedriskblog.com/">Calculated Risk</a> and myself have updated our respective home affordability metrics in the last day or so.  We're all using slightly different numbers (the housing world is awash in data attempting to measure the same thing), but I'd say we all have about the same conclusions to draw.  Housing is definitely becoming more affordable.  CR notes that <a href="http://www.calculatedriskblog.com/2011/05/real-corelogic-house-price-index-and.html">the national price-to-rent index from the CoreLogic home price series has now returned to 1999 levels</a>.  As the 90s were generally a non-boomy time for housing, this is real progress.</p> 
<p>Looking at the data from a metro perspective, <a href="http://economix.blogs.nytimes.com/2011/05/10/rent-vs-buy-a-longer-list/">David Leonhardt sees more price-to-rent ratios under 15</a> (his threshold for affordability).  He mentions <a href="http://www.deptofnumbers.com/affordability/georgia/atlanta">Atlanta</a>, Los Angeles, <a href="http://www.deptofnumbers.com/affordability/florida/miami">Miami</a>, <a href="http://www.deptofnumbers.com/affordability/minnesota/minneapolis">Minneapolis</a>, <a href="http://www.deptofnumbers.com/affordability/missouri/st-louis">St. Louis</a>, <a href="http://www.deptofnumbers.com/affordability/nevada/las-vegas">Las Vegas</a>, <a href="http://www.deptofnumbers.com/affordability/ohio/cleveland">Cleveland</a>, Detroit, <a href="http://www.deptofnumbers.com/affordability/arizona/phoenix">Phoenix</a>, Pittsburgh and <a href="http://www.deptofnumbers.com/affordability/florida/tampa">Tampa</a> as places where the rent-ratios on homes are looking good these days.  I agree with the assessment for all of those cities with the exception of Los Angeles.  I'm not sure how <a href="http://www.moodysanalytics.com/">Moody's Analytics</a> (Leonhardt's source) arrived at the low rent-ratio they did, but I'm not finding comparable figures.  The home affordability numbers I've calculated show considerably higher <a href="http://www.deptofnumbers.com/affordability/california/los-angeles">price-to-rent and price-to-income ratios for LA</a>.</p>
<p>So let's look at the LA data a little closer as an example of how we arrive at these ratios.  According to <a href="http://www.realtor.org/research/research/metroprice">Realtor metro price statistics</a>, the median home in Los Angeles sold for $292,700 in the first quarter of 2011.  The <a href="http://www.census.gov/acs/www/">Census</a> reports that the median contract rent for the city in 2009 (the latest data available) was $1,111.  This yields a price-to-annual rent ratio of 21.95 $292,700/(12*$1,111).  If you adjust the median contract rent by the household size (<a href="http://www.deptofnumbers.com/blog/2010/05/adjusted-price-to-rent">as described here</a>), the adjusted median contract rent for LA increases to $1,206 per month and this reduces the rent ratio to 20.22.  This still seems fairly high to me; it's certainly not in the realm of Atlanta, Las Vegas or Tampa affordability at least.</p>
<p>More importantly though, I think David answers the buy vs. rent question exactly right.  In many places it's not a bad time to buy a home assuming relative affordability, access to credit, a steady income and (perhaps most significantly) no need to sell for <i>at least</i> five years.</p>
<p>I've appended the metro affordability ratio table below so you can compare cities yourself.  In addition to the price-to-rent and price-to-income ratios there is also the rent-to-mortgage ratio.  It behaves just like the price-to-rent ratio when sorted, but the value of this ratio actually has a bit more intuitive meaning.  A value of 1.0 means that the rent is equal to the payment on a 100% loan-to-value 30 year fixed-rate mortgage at prevailing rates.  Values greater than 1.0 mean that renting costs more and values less than 1.0 mean the mortgage payment costs more (under these particular mortgage terms).  As a potential buyer or investor, you're looking for rent-to-mortgage ratios of greater than 1.0 because it means you could conceivably pay less to own than to rent.  Click on the heading name to sort the cities. It's fun &mdash; unless you're thinking about buying in <a href="http://www.deptofnumbers.com/affordability/hawaii/honolulu">Honolulu</a>.</p>
<p><b>Note:</b> The latest metro affordability data is always available <a href="http://www.deptofnumbers.com/affordability/metros">here</a>.</p>

          <h3> 
            Home Income and Rent Ratios Using Realtor Prices by City - Q1 2011
          </h3><script type="text/javascript"> 
//<![CDATA[
          $(document).ready(function() { $("#metro_affordability_ratios_2011Q1").tablesorter({sortList:[[0,0],[2,1]], widgets: ['zebra'], widgetZebra: {css: ["odd","even"]} }); }); 
          //]]>
<table summary="">
      <thead>
        <tr>
          <th>City, State</th>
          <th>
            <a href="#">Price-to-Income
            <br />(Dollar Ratio)</a>
          </th>
          <th>
            <a href="#">Adj. Price-to-Rent
            <br />(Dollar Ratio)</a>
          </th>
          <th>
            <a href="#">Adj. Rent-to-Mortgage
            <br />(Dollar Ratio)</a>
          </th>
        </tr>
      </thead>
      <tbody>
        <tr>
          <td>&#160;
          <b>
            <a href='http://www.deptofnumbers.com/affordability/us'>US</a>
          </b></td>
          <td>3.43</td>
          <td>18.53</td>
          <td>0.87</td>
        </tr>
        <tr>
          <td>&#160;
          <a href='http://www.deptofnumbers.com/affordability/alabama/birmingham'>Birmingham, Alabama</a></td>
          <td>2.95</td>
          <td>18.43</td>
          <td>0.86</td>
        </tr>
        <tr>
          <td>&#160;
          <a href='http://www.deptofnumbers.com/affordability/alabama/mobile'>Mobile, Alabama</a></td>
          <td>2.67</td>
          <td>15.09</td>
          <td>1.05</td>
        </tr>
        <tr>
          <td>&#160;
          <a href='http://www.deptofnumbers.com/affordability/alabama/montgomery'>Montgomery, Alabama</a></td>
          <td>2.70</td>
          <td>17.18</td>
          <td>0.92</td>
        </tr>
        <tr>
          <td>&#160;
          <a href='http://www.deptofnumbers.com/affordability/arizona/phoenix'>Phoenix, Arizona</a></td>
          <td>2.40</td>
          <td>13.69</td>
          <td>1.15</td>
        </tr>
        <tr>
          <td>&#160;
          <a href='http://www.deptofnumbers.com/affordability/arizona/tucson'>Tucson, Arizona</a></td>
          <td>3.17</td>
          <td>17.48</td>
          <td>0.90</td>
        </tr>
        <tr>
          <td>&#160;
          <a href='http://www.deptofnumbers.com/affordability/arkansas/little-rock'>Little Rock, Arkansas</a></td>
          <td>2.78</td>
          <td>16.89</td>
          <td>0.94</td>
        </tr>
        <tr>
          <td>&#160;
          <a href='http://www.deptofnumbers.com/affordability/california/los-angeles'>Los Angeles, California</a></td>
          <td>5.00</td>
          <td>20.22</td>
          <td>0.78</td>
        </tr>
        <tr>
          <td>&#160;Riverside, California</td>
          <td>3.22</td>
          <td>15.02</td>
          <td>1.05</td>
        </tr>
        <tr>
          <td>&#160;
          <a href='http://www.deptofnumbers.com/affordability/california/sacramento'>Sacramento, California</a></td>
          <td>2.95</td>
          <td>15.43</td>
          <td>1.02</td>
        </tr>
        <tr>
          <td>&#160;
          <a href='http://www.deptofnumbers.com/affordability/california/san-diego'>San Diego, California</a></td>
          <td>6.22</td>
          <td>25.96</td>
          <td>0.61</td>
        </tr>
        <tr>
          <td>&#160;
          <a href='http://www.deptofnumbers.com/affordability/california/san-francisco'>San Francisco, California</a></td>
          <td>6.31</td>
          <td>27.86</td>
          <td>0.57</td>
        </tr>
        <tr>
          <td>&#160;San Jose, California</td>
          <td>6.45</td>
          <td>30.53</td>
          <td>0.52</td>
        </tr>
        <tr>
          <td>&#160;Boulder, Colorado</td>
          <td>5.57</td>
          <td>28.51</td>
          <td>0.55</td>
        </tr>
        <tr>
          <td>&#160;
          <a href='http://www.deptofnumbers.com/affordability/colorado/colorado-springs'>Colorado Springs, Colorado</a></td>
          <td>3.34</td>
          <td>19.91</td>
          <td>0.79</td>
        </tr>
        <tr>
          <td>&#160;
          <a href='http://www.deptofnumbers.com/affordability/colorado/denver'>Denver, Colorado</a></td>
          <td>3.79</td>
          <td>21.39</td>
          <td>0.74</td>
        </tr>
        <tr>
          <td>&#160;Bridgeport, Connecticut</td>
          <td>4.33</td>
          <td>23.20</td>
          <td>0.68</td>
        </tr>
        <tr>
          <td>&#160;
          <a href='http://www.deptofnumbers.com/affordability/connecticut/hartford'>Hartford, Connecticut</a></td>
          <td>3.25</td>
          <td>19.20</td>
          <td>0.82</td>
        </tr>
        <tr>
          <td>&#160;New Haven, Connecticut</td>
          <td>3.49</td>
          <td>17.22</td>
          <td>0.92</td>
        </tr>
        <tr>
          <td>&#160;Norwich, Connecticut</td>
          <td>2.76</td>
          <td>15.01</td>
          <td>1.05</td>
        </tr>
        <tr>
          <td>&#160;
          <a href='http://www.deptofnumbers.com/affordability/delaware/dover'>Dover, Delaware</a></td>
          <td>3.23</td>
          <td>17.76</td>
          <td>0.89</td>
        </tr>
        <tr>
          <td>&#160;
          <a href='http://www.deptofnumbers.com/affordability/district-of-columbia/washington'>Washington, District of Columbia</a></td>
          <td>3.46</td>
          <td>17.95</td>
          <td>0.88</td>
        </tr>
        <tr>
          <td>&#160;Cape Coral, Florida</td>
          <td>2.02</td>
          <td>10.64</td>
          <td>1.49</td>
        </tr>
        <tr>
          <td>&#160;Deltona, Florida</td>
          <td>2.66</td>
          <td>12.93</td>
          <td>1.22</td>
        </tr>
        <tr>
          <td>&#160;
          <a href='http://www.deptofnumbers.com/affordability/florida/gainesville'>Gainesville, Florida</a></td>
          <td>3.89</td>
          <td>16.66</td>
          <td>0.95</td>
        </tr>
        <tr>
          <td>&#160;
          <a href='http://www.deptofnumbers.com/affordability/florida/jacksonville'>Jacksonville, Florida</a></td>
          <td>2.55</td>
          <td>13.07</td>
          <td>1.21</td>
        </tr>
        <tr>
          <td>&#160;
          <a href='http://www.deptofnumbers.com/affordability/florida/miami'>Miami, Florida</a></td>
          <td>3.34</td>
          <td>13.39</td>
          <td>1.18</td>
        </tr>
        <tr>
          <td>&#160;
          <a href='http://www.deptofnumbers.com/affordability/florida/ocala'>Ocala, Florida</a></td>
          <td>1.93</td>
          <td>10.33</td>
          <td>1.53</td>
        </tr>
        <tr>
          <td>&#160;
          <a href='http://www.deptofnumbers.com/affordability/florida/orlando'>Orlando, Florida</a></td>
          <td>2.55</td>
          <td>11.76</td>
          <td>1.34</td>
        </tr>
        <tr>
          <td>&#160;Palm Bay, Florida</td>
          <td>1.97</td>
          <td>9.71</td>
          <td>1.63</td>
        </tr>
        <tr>
          <td>&#160;
          <a href='http://www.deptofnumbers.com/affordability/florida/pensacola'>Pensacola, Florida</a></td>
          <td>2.88</td>
          <td>15.58</td>
          <td>1.01</td>
        </tr>
        <tr>
          <td>&#160;
          <a href='http://www.deptofnumbers.com/affordability/florida/tallahassee'>Tallahassee, Florida</a></td>
          <td>3.34</td>
          <td>15.08</td>
          <td>1.05</td>
        </tr>
        <tr>
          <td>&#160;
          <a href='http://www.deptofnumbers.com/affordability/florida/tampa'>Tampa, Florida</a></td>
          <td>2.58</td>
          <td>11.93</td>
          <td>1.33</td>
        </tr>
        <tr>
          <td>&#160;
          <a href='http://www.deptofnumbers.com/affordability/georgia/atlanta'>Atlanta, Georgia</a></td>
          <td>1.80</td>
          <td>10.58</td>
          <td>1.49</td>
        </tr>
        <tr>
          <td>&#160;
          <a href='http://www.deptofnumbers.com/affordability/hawaii/honolulu'>Honolulu, Hawaii</a></td>
          <td>8.55</td>
          <td>33.01</td>
          <td>0.48</td>
        </tr>
        <tr>
          <td>&#160;
          <a href='http://www.deptofnumbers.com/affordability/idaho/boise-city'>Boise City, Idaho</a></td>
          <td>2.64</td>
          <td>15.70</td>
          <td>1.01</td>
        </tr>
        <tr>
          <td>&#160;
          <a href='http://www.deptofnumbers.com/affordability/illinois/bloomington'>Bloomington, Illinois</a></td>
          <td>2.66</td>
          <td>17.81</td>
          <td>0.89</td>
        </tr>
        <tr>
          <td>&#160;
          <a href='http://www.deptofnumbers.com/affordability/illinois/champaign'>Champaign, Illinois</a></td>
          <td>3.21</td>
          <td>15.28</td>
          <td>1.03</td>
        </tr>
        <tr>
          <td>&#160;
          <a href='http://www.deptofnumbers.com/affordability/illinois/chicago'>Chicago, Illinois</a></td>
          <td>2.64</td>
          <td>13.97</td>
          <td>1.13</td>
        </tr>
        <tr>
          <td>&#160;
          <a href='http://www.deptofnumbers.com/affordability/illinois/decatur'>Decatur, Illinois</a></td>
          <td>1.84</td>
          <td>13.41</td>
          <td>1.18</td>
        </tr>
        <tr>
          <td>&#160;Kankakee, Illinois</td>
          <td>2.16</td>
          <td>13.67</td>
          <td>1.16</td>
        </tr>
        <tr>
          <td>&#160;
          <a href='http://www.deptofnumbers.com/affordability/illinois/peoria'>Peoria, Illinois</a></td>
          <td>2.02</td>
          <td>14.24</td>
          <td>1.11</td>
        </tr>
        <tr>
          <td>&#160;
          <a href='http://www.deptofnumbers.com/affordability/illinois/rockford'>Rockford, Illinois</a></td>
          <td>2.02</td>
          <td>12.02</td>
          <td>1.31</td>
        </tr>
        <tr>
          <td>&#160;
          <a href='http://www.deptofnumbers.com/affordability/illinois/springfield'>Springfield, Illinois</a></td>
          <td>2.23</td>
          <td>16.46</td>
          <td>0.96</td>
        </tr>
        <tr>
          <td>&#160;
          <a href='http://www.deptofnumbers.com/affordability/indiana/fort-wayne'>Fort Wayne, Indiana</a></td>
          <td>1.75</td>
          <td>10.99</td>
          <td>1.44</td>
        </tr>
        <tr>
          <td>&#160;
          <a href='http://www.deptofnumbers.com/affordability/indiana/indianapolis'>Indianapolis, Indiana</a></td>
          <td>2.18</td>
          <td>13.41</td>
          <td>1.18</td>
        </tr>
        <tr>
          <td>&#160;
          <a href='http://www.deptofnumbers.com/affordability/indiana/south-bend'>South Bend, Indiana</a></td>
          <td>1.58</td>
          <td>8.94</td>
          <td>1.77</td>
        </tr>
        <tr>
          <td>&#160;
          <a href='http://www.deptofnumbers.com/affordability/iowa/cedar-rapids'>Cedar Rapids, Iowa</a></td>
          <td>2.43</td>
          <td>16.33</td>
          <td>0.97</td>
        </tr>
        <tr>
          <td>&#160;
          <a href='http://www.deptofnumbers.com/affordability/iowa/davenport'>Davenport, Iowa</a></td>
          <td>1.88</td>
          <td>12.78</td>
          <td>1.24</td>
        </tr>
        <tr>
          <td>&#160;
          <a href='http://www.deptofnumbers.com/affordability/iowa/des-moines'>Des Moines, Iowa</a></td>
          <td>2.36</td>
          <td>14.73</td>
          <td>1.07</td>
        </tr>
        <tr>
          <td>&#160;
          <a href='http://www.deptofnumbers.com/affordability/iowa/waterloo'>Waterloo, Iowa</a></td>
          <td>2.21</td>
          <td>14.87</td>
          <td>1.06</td>
        </tr>
        <tr>
          <td>&#160;
          <a href='http://www.deptofnumbers.com/affordability/kansas/topeka'>Topeka, Kansas</a></td>
          <td>1.92</td>
          <td>14.12</td>
          <td>1.12</td>
        </tr>
        <tr>
          <td>&#160;
          <a href='http://www.deptofnumbers.com/affordability/kansas/wichita'>Wichita, Kansas</a></td>
          <td>2.19</td>
          <td>15.82</td>
          <td>1.00</td>
        </tr>
        <tr>
          <td>&#160;
          <a href='http://www.deptofnumbers.com/affordability/kentucky/lexington'>Lexington, Kentucky</a></td>
          <td>2.85</td>
          <td>18.05</td>
          <td>0.88</td>
        </tr>
        <tr>
          <td>&#160;
          <a href='http://www.deptofnumbers.com/affordability/kentucky/louisville'>Louisville, Kentucky</a></td>
          <td>2.67</td>
          <td>16.95</td>
          <td>0.93</td>
        </tr>
        <tr>
          <td>&#160;
          <a href='http://www.deptofnumbers.com/affordability/louisiana/baton-rouge'>Baton Rouge, Louisiana</a></td>
          <td>3.36</td>
          <td>20.14</td>
          <td>0.78</td>
        </tr>
        <tr>
          <td>&#160;
          <a href='http://www.deptofnumbers.com/affordability/louisiana/new-orleans'>New Orleans, Louisiana</a></td>
          <td>3.20</td>
          <td>15.45</td>
          <td>1.02</td>
        </tr>
        <tr>
          <td>&#160;
          <a href='http://www.deptofnumbers.com/affordability/louisiana/shreveport'>Shreveport, Louisiana</a></td>
          <td>3.81</td>
          <td>21.02</td>
          <td>0.75</td>
        </tr>
        <tr>
          <td>&#160;
          <a href='http://www.deptofnumbers.com/affordability/maine/portland'>Portland, Maine</a></td>
          <td>3.71</td>
          <td>17.52</td>
          <td>0.90</td>
        </tr>
        <tr>
          <td>&#160;Baltimore, Maryland</td>
          <td>3.25</td>
          <td>17.92</td>
          <td>0.88</td>
        </tr>
        <tr>
          <td>&#160;
          <a href='http://www.deptofnumbers.com/affordability/maryland/cumberland'>Cumberland, Maryland</a></td>
          <td>2.23</td>
          <td>15.56</td>
          <td>1.02</td>
        </tr>
        <tr>
          <td>&#160;Hagerstown, Maryland</td>
          <td>2.49</td>
          <td>16.03</td>
          <td>0.99</td>
        </tr>
        <tr>
          <td>&#160;Barnstable Town, Massachusetts</td>
          <td>5.16</td>
          <td>25.85</td>
          <td>0.61</td>
        </tr>
        <tr>
          <td>&#160;
          <a href='http://www.deptofnumbers.com/affordability/massachusetts/boston'>Boston, Massachusetts</a></td>
          <td>4.65</td>
          <td>21.49</td>
          <td>0.74</td>
        </tr>
        <tr>
          <td>&#160;
          <a href='http://www.deptofnumbers.com/affordability/massachusetts/pittsfield'>Pittsfield, Massachusetts</a></td>
          <td>4.08</td>
          <td>17.50</td>
          <td>0.90</td>
        </tr>
        <tr>
          <td>&#160;
          <a href='http://www.deptofnumbers.com/affordability/massachusetts/springfield'>Springfield, Massachusetts</a></td>
          <td>3.44</td>
          <td>18.65</td>
          <td>0.85</td>
        </tr>
        <tr>
          <td>&#160;Worcester, Massachusetts</td>
          <td>3.14</td>
          <td>18.15</td>
          <td>0.87</td>
        </tr>
        <tr>
          <td>&#160;
          <a href='http://www.deptofnumbers.com/affordability/michigan/grand-rapids'>Grand Rapids, Michigan</a></td>
          <td>1.72</td>
          <td>9.99</td>
          <td>1.58</td>
        </tr>
        <tr>
          <td>&#160;
          <a href='http://www.deptofnumbers.com/affordability/michigan/lansing'>Lansing, Michigan</a></td>
          <td>1.35</td>
          <td>7.28</td>
          <td>2.17</td>
        </tr>
        <tr>
          <td>&#160;
          <a href='http://www.deptofnumbers.com/affordability/minnesota/minneapolis'>Minneapolis, Minnesota</a></td>
          <td>2.23</td>
          <td>12.30</td>
          <td>1.29</td>
        </tr>
        <tr>
          <td>&#160;Gulfport, Mississippi</td>
          <td>2.31</td>
          <td>10.98</td>
          <td>1.44</td>
        </tr>
        <tr>
          <td>&#160;
          <a href='http://www.deptofnumbers.com/affordability/mississippi/jackson'>Jackson, Mississippi</a></td>
          <td>3.04</td>
          <td>18.49</td>
          <td>0.86</td>
        </tr>
        <tr>
          <td>&#160;
          <a href='http://www.deptofnumbers.com/affordability/missouri/columbia'>Columbia, Missouri</a></td>
          <td>3.21</td>
          <td>17.59</td>
          <td>0.90</td>
        </tr>
        <tr>
          <td>&#160;
          <a href='http://www.deptofnumbers.com/affordability/missouri/kansas-city'>Kansas City, Missouri</a></td>
          <td>2.30</td>
          <td>14.68</td>
          <td>1.08</td>
        </tr>
        <tr>
          <td>&#160;
          <a href='http://www.deptofnumbers.com/affordability/missouri/springfield'>Springfield, Missouri</a></td>
          <td>2.80</td>
          <td>15.58</td>
          <td>1.01</td>
        </tr>
        <tr>
          <td>&#160;
          <a href='http://www.deptofnumbers.com/affordability/missouri/st-louis'>St Louis, Missouri</a></td>
          <td>2.08</td>
          <td>13.09</td>
          <td>1.21</td>
        </tr>
        <tr>
          <td>&#160;
          <a href='http://www.deptofnumbers.com/affordability/nebraska/lincoln'>Lincoln, Nebraska</a></td>
          <td>2.77</td>
          <td>16.23</td>
          <td>0.97</td>
        </tr>
        <tr>
          <td>&#160;
          <a href='http://www.deptofnumbers.com/affordability/nebraska/omaha'>Omaha, Nebraska</a></td>
          <td>2.46</td>
          <td>14.59</td>
          <td>1.08</td>
        </tr>
        <tr>
          <td>&#160;
          <a href='http://www.deptofnumbers.com/affordability/nevada/las-vegas'>Las Vegas, Nevada</a></td>
          <td>2.40</td>
          <td>11.84</td>
          <td>1.33</td>
        </tr>
        <tr>
          <td>&#160;
          <a href='http://www.deptofnumbers.com/affordability/nevada/reno'>Reno, Nevada</a></td>
          <td>3.15</td>
          <td>16.95</td>
          <td>0.93</td>
        </tr>
        <tr>
          <td>&#160;Manchester, New Hampshire</td>
          <td>3.16</td>
          <td>16.35</td>
          <td>0.97</td>
        </tr>
        <tr>
          <td>&#160;Atlantic City, New Jersey</td>
          <td>4.02</td>
          <td>19.72</td>
          <td>0.80</td>
        </tr>
        <tr>
          <td>&#160;Trenton, New Jersey</td>
          <td>3.05</td>
          <td>17.76</td>
          <td>0.89</td>
        </tr>
        <tr>
          <td>&#160;
          <a href='http://www.deptofnumbers.com/affordability/new-mexico/albuquerque'>Albuquerque, New Mexico</a></td>
          <td>3.58</td>
          <td>19.20</td>
          <td>0.82</td>
        </tr>
        <tr>
          <td>&#160;Farmington, New Mexico</td>
          <td>3.80</td>
          <td>27.48</td>
          <td>0.58</td>
        </tr>
        <tr>
          <td>&#160;
          <a href='http://www.deptofnumbers.com/affordability/new-york/binghamton'>Binghamton, New York</a></td>
          <td>2.41</td>
          <td>14.51</td>
          <td>1.09</td>
        </tr>
        <tr>
          <td>&#160;
          <a href='http://www.deptofnumbers.com/affordability/new-york/buffalo'>Buffalo, New York</a></td>
          <td>2.58</td>
          <td>15.18</td>
          <td>1.04</td>
        </tr>
        <tr>
          <td>&#160;
          <a href='http://www.deptofnumbers.com/affordability/new-york/elmira'>Elmira, New York</a></td>
          <td>2.02</td>
          <td>11.09</td>
          <td>1.43</td>
        </tr>
        <tr>
          <td>&#160;
          <a href='http://www.deptofnumbers.com/affordability/new-york/glens-falls'>Glens Falls, New York</a></td>
          <td>2.77</td>
          <td>16.56</td>
          <td>0.95</td>
        </tr>
        <tr>
          <td>&#160;Kingston, New York</td>
          <td>3.56</td>
          <td>18.64</td>
          <td>0.85</td>
        </tr>
        <tr>
          <td>&#160;
          <a href='http://www.deptofnumbers.com/affordability/new-york/new-york'>New York, New York</a></td>
          <td>5.98</td>
          <td>26.55</td>
          <td>0.60</td>
        </tr>
        <tr>
          <td>&#160;
          <a href='http://www.deptofnumbers.com/affordability/new-york/rochester'>Rochester, New York</a></td>
          <td>2.27</td>
          <td>12.34</td>
          <td>1.28</td>
        </tr>
        <tr>
          <td>&#160;
          <a href='http://www.deptofnumbers.com/affordability/new-york/syracuse'>Syracuse, New York</a></td>
          <td>2.31</td>
          <td>14.01</td>
          <td>1.13</td>
        </tr>
        <tr>
          <td>&#160;
          <a href='http://www.deptofnumbers.com/affordability/north-carolina/charlotte'>Charlotte, North Carolina</a></td>
          <td>3.81</td>
          <td>21.84</td>
          <td>0.72</td>
        </tr>
        <tr>
          <td>&#160;Durham, North Carolina</td>
          <td>3.17</td>
          <td>17.70</td>
          <td>0.89</td>
        </tr>
        <tr>
          <td>&#160;
          <a href='http://www.deptofnumbers.com/affordability/north-carolina/greensboro'>Greensboro, North Carolina</a></td>
          <td>2.80</td>
          <td>16.30</td>
          <td>0.97</td>
        </tr>
        <tr>
          <td>&#160;
          <a href='http://www.deptofnumbers.com/affordability/north-carolina/raleigh'>Raleigh, North Carolina</a></td>
          <td>3.88</td>
          <td>25.10</td>
          <td>0.63</td>
        </tr>
        <tr>
          <td>&#160;
          <a href='http://www.deptofnumbers.com/affordability/north-dakota/bismarck'>Bismarck, North Dakota</a></td>
          <td>2.86</td>
          <td>18.19</td>
          <td>0.87</td>
        </tr>
        <tr>
          <td>&#160;
          <a href='http://www.deptofnumbers.com/affordability/north-dakota/fargo'>Fargo, North Dakota</a></td>
          <td>3.06</td>
          <td>14.82</td>
          <td>1.07</td>
        </tr>
        <tr>
          <td>&#160;
          <a href='http://www.deptofnumbers.com/affordability/ohio/canton'>Canton, Ohio</a></td>
          <td>1.98</td>
          <td>13.07</td>
          <td>1.21</td>
        </tr>
        <tr>
          <td>&#160;
          <a href='http://www.deptofnumbers.com/affordability/ohio/cincinnati'>Cincinnati, Ohio</a></td>
          <td>2.18</td>
          <td>14.39</td>
          <td>1.10</td>
        </tr>
        <tr>
          <td>&#160;
          <a href='http://www.deptofnumbers.com/affordability/ohio/cleveland'>Cleveland, Ohio</a></td>
          <td>1.92</td>
          <td>10.40</td>
          <td>1.52</td>
        </tr>
        <tr>
          <td>&#160;
          <a href='http://www.deptofnumbers.com/affordability/ohio/columbus'>Columbus, Ohio</a></td>
          <td>2.25</td>
          <td>13.87</td>
          <td>1.14</td>
        </tr>
        <tr>
          <td>&#160;
          <a href='http://www.deptofnumbers.com/affordability/ohio/dayton'>Dayton, Ohio</a></td>
          <td>1.73</td>
          <td>11.07</td>
          <td>1.43</td>
        </tr>
        <tr>
          <td>&#160;
          <a href='http://www.deptofnumbers.com/affordability/ohio/toledo'>Toledo, Ohio</a></td>
          <td>1.50</td>
          <td>9.30</td>
          <td>1.70</td>
        </tr>
        <tr>
          <td>&#160;
          <a href='http://www.deptofnumbers.com/affordability/ohio/youngstown'>Youngstown, Ohio</a></td>
          <td>1.35</td>
          <td>8.72</td>
          <td>1.81</td>
        </tr>
        <tr>
          <td>&#160;
          <a href='http://www.deptofnumbers.com/affordability/oklahoma/oklahoma-city'>Oklahoma City, Oklahoma</a></td>
          <td>2.87</td>
          <td>18.55</td>
          <td>0.85</td>
        </tr>
        <tr>
          <td>&#160;
          <a href='http://www.deptofnumbers.com/affordability/oklahoma/tulsa'>Tulsa, Oklahoma</a></td>
          <td>2.65</td>
          <td>17.08</td>
          <td>0.93</td>
        </tr>
        <tr>
          <td>&#160;
          <a href='http://www.deptofnumbers.com/affordability/oregon/portland'>Portland, Oregon</a></td>
          <td>3.84</td>
          <td>20.44</td>
          <td>0.77</td>
        </tr>
        <tr>
          <td>&#160;Salem, Oregon</td>
          <td>3.42</td>
          <td>20.17</td>
          <td>0.78</td>
        </tr>
        <tr>
          <td>&#160;
          <a href='http://www.deptofnumbers.com/affordability/pennsylvania/allentown'>Allentown, Pennsylvania</a></td>
          <td>3.28</td>
          <td>17.90</td>
          <td>0.88</td>
        </tr>
        <tr>
          <td>&#160;
          <a href='http://www.deptofnumbers.com/affordability/pennsylvania/erie'>Erie, Pennsylvania</a></td>
          <td>2.20</td>
          <td>12.76</td>
          <td>1.24</td>
        </tr>
        <tr>
          <td>&#160;
          <a href='http://www.deptofnumbers.com/affordability/pennsylvania/philadelphia'>Philadelphia, Pennsylvania</a></td>
          <td>3.31</td>
          <td>17.68</td>
          <td>0.89</td>
        </tr>
        <tr>
          <td>&#160;
          <a href='http://www.deptofnumbers.com/affordability/pennsylvania/reading'>Reading, Pennsylvania</a></td>
          <td>2.62</td>
          <td>14.92</td>
          <td>1.06</td>
        </tr>
        <tr>
          <td>&#160;
          <a href='http://www.deptofnumbers.com/affordability/rhode-island/providence'>Providence, Rhode Island</a></td>
          <td>3.85</td>
          <td>19.69</td>
          <td>0.80</td>
        </tr>
        <tr>
          <td>&#160;
          <a href='http://www.deptofnumbers.com/affordability/south-carolina/charleston'>Charleston, South Carolina</a></td>
          <td>3.80</td>
          <td>19.24</td>
          <td>0.82</td>
        </tr>
        <tr>
          <td>&#160;
          <a href='http://www.deptofnumbers.com/affordability/south-carolina/columbia'>Columbia, South Carolina</a></td>
          <td>2.85</td>
          <td>18.17</td>
          <td>0.87</td>
        </tr>
        <tr>
          <td>&#160;
          <a href='http://www.deptofnumbers.com/affordability/south-carolina/florence'>Florence, South Carolina</a></td>
          <td>2.81</td>
          <td>19.77</td>
          <td>0.80</td>
        </tr>
        <tr>
          <td>&#160;
          <a href='http://www.deptofnumbers.com/affordability/south-carolina/greenville'>Greenville, South Carolina</a></td>
          <td>3.17</td>
          <td>19.93</td>
          <td>0.79</td>
        </tr>
        <tr>
          <td>&#160;Spartanburg, South Carolina</td>
          <td>2.72</td>
          <td>17.74</td>
          <td>0.89</td>
        </tr>
        <tr>
          <td>&#160;
          <a href='http://www.deptofnumbers.com/affordability/south-dakota/sioux-falls'>Sioux Falls, South Dakota</a></td>
          <td>2.92</td>
          <td>17.21</td>
          <td>0.92</td>
        </tr>
        <tr>
          <td>&#160;
          <a href='http://www.deptofnumbers.com/affordability/tennessee/chattanooga'>Chattanooga, Tennessee</a></td>
          <td>2.88</td>
          <td>17.33</td>
          <td>0.91</td>
        </tr>
        <tr>
          <td>&#160;
          <a href='http://www.deptofnumbers.com/affordability/tennessee/knoxville'>Knoxville, Tennessee</a></td>
          <td>3.09</td>
          <td>18.53</td>
          <td>0.85</td>
        </tr>
        <tr>
          <td>&#160;
          <a href='http://www.deptofnumbers.com/affordability/tennessee/memphis'>Memphis, Tennessee</a></td>
          <td>2.39</td>
          <td>14.24</td>
          <td>1.11</td>
        </tr>
        <tr>
          <td>&#160;
          <a href='http://www.deptofnumbers.com/affordability/texas/amarillo'>Amarillo, Texas</a></td>
          <td>2.78</td>
          <td>15.84</td>
          <td>1.00</td>
        </tr>
        <tr>
          <td>&#160;
          <a href='http://www.deptofnumbers.com/affordability/texas/austin'>Austin, Texas</a></td>
          <td>3.35</td>
          <td>17.84</td>
          <td>0.89</td>
        </tr>
        <tr>
          <td>&#160;
          <a href='http://www.deptofnumbers.com/affordability/texas/beaumont'>Beaumont, Texas</a></td>
          <td>2.86</td>
          <td>17.24</td>
          <td>0.92</td>
        </tr>
        <tr>
          <td>&#160;
          <a href='http://www.deptofnumbers.com/affordability/texas/corpus-christi'>Corpus Christi, Texas</a></td>
          <td>3.16</td>
          <td>17.35</td>
          <td>0.91</td>
        </tr>
        <tr>
          <td>&#160;
          <a href='http://www.deptofnumbers.com/affordability/texas/dallas'>Dallas, Texas</a></td>
          <td>2.62</td>
          <td>15.04</td>
          <td>1.05</td>
        </tr>
        <tr>
          <td>&#160;
          <a href='http://www.deptofnumbers.com/affordability/texas/el-paso'>El Paso, Texas</a></td>
          <td>3.64</td>
          <td>18.96</td>
          <td>0.83</td>
        </tr>
        <tr>
          <td>&#160;
          <a href='http://www.deptofnumbers.com/affordability/texas/houston'>Houston, Texas</a></td>
          <td>2.74</td>
          <td>16.20</td>
          <td>0.98</td>
        </tr>
        <tr>
          <td>&#160;
          <a href='http://www.deptofnumbers.com/affordability/texas/san-antonio'>San Antonio, Texas</a></td>
          <td>3.10</td>
          <td>16.94</td>
          <td>0.93</td>
        </tr>
        <tr>
          <td>&#160;
          <a href='http://www.deptofnumbers.com/affordability/utah/salt-lake-city'>Salt Lake City, Utah</a></td>
          <td>3.33</td>
          <td>17.28</td>
          <td>0.91</td>
        </tr>
        <tr>
          <td>&#160;
          <a href='http://www.deptofnumbers.com/affordability/vermont/burlington'>Burlington, Vermont</a></td>
          <td>4.66</td>
          <td>20.71</td>
          <td>0.76</td>
        </tr>
        <tr>
          <td>&#160;Virginia Beach, Virginia</td>
          <td>3.22</td>
          <td>16.21</td>
          <td>0.98</td>
        </tr>
        <tr>
          <td>&#160;Kennewick, Washington</td>
          <td>3.25</td>
          <td>21.61</td>
          <td>0.73</td>
        </tr>
        <tr>
          <td>&#160;
          <a href='http://www.deptofnumbers.com/affordability/washington/seattle'>Seattle, Washington</a></td>
          <td>4.48</td>
          <td>22.54</td>
          <td>0.70</td>
        </tr>
        <tr>
          <td>&#160;
          <a href='http://www.deptofnumbers.com/affordability/washington/spokane'>Spokane, Washington</a></td>
          <td>3.57</td>
          <td>17.88</td>
          <td>0.88</td>
        </tr>
        <tr>
          <td>&#160;
          <a href='http://www.deptofnumbers.com/affordability/washington/yakima'>Yakima, Washington</a></td>
          <td>3.43</td>
          <td>22.22</td>
          <td>0.71</td>
        </tr>
        <tr>
          <td>&#160;
          <a href='http://www.deptofnumbers.com/affordability/west-virginia/charleston'>Charleston, West Virginia</a></td>
          <td>2.90</td>
          <td>20.22</td>
          <td>0.78</td>
        </tr>
        <tr>
          <td>&#160;
          <a href='http://www.deptofnumbers.com/affordability/wisconsin/appleton'>Appleton, Wisconsin</a></td>
          <td>2.07</td>
          <td>13.58</td>
          <td>1.16</td>
        </tr>
        <tr>
          <td>&#160;
          <a href='http://www.deptofnumbers.com/affordability/wisconsin/green-bay'>Green Bay, Wisconsin</a></td>
          <td>2.55</td>
          <td>16.27</td>
          <td>0.97</td>
        </tr>
        <tr>
          <td>&#160;
          <a href='http://www.deptofnumbers.com/affordability/wisconsin/madison'>Madison, Wisconsin</a></td>
          <td>3.81</td>
          <td>19.75</td>
          <td>0.80</td>
        </tr>
        <tr>
          <td>&#160;
          <a href='http://www.deptofnumbers.com/affordability/wisconsin/milwaukee'>Milwaukee, Wisconsin</a></td>
          <td>3.49</td>
          <td>19.76</td>
          <td>0.80</td>
        </tr>
      </tbody>
    </table>]]&gt;</content>
  </entry>
</feed>

