
Real House Prices and Real Borrowing Costs
Posted Tuesday, September 18 2012
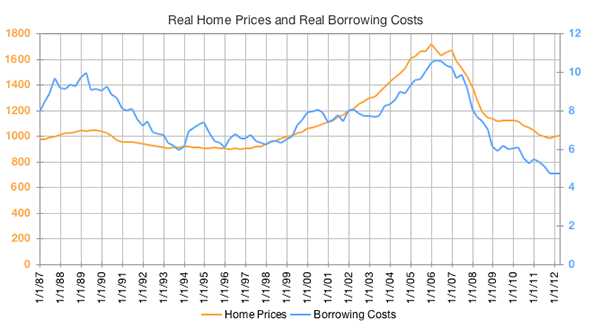
The chart above shows real house prices (in orange) defined as the national Case-Shiller index adjusted for inflation via the CPI less shelter series. I've normalized the series to equal 1000 at its most recent value in April 2012. Real house prices peaked at the beginning of 2006 and are now back to early 1999 (and before that mid 1990) levels.
If you look at historic mortgage rates over that time you can also calculate the real cost of borrowing on a value that changes with the real home price series. That new series is blue in the chart. Here I've simply calculated the borrowing cost for the indexed value of the Case-Shiller series at each point in time. For instance, in April of this year, the real Case-Shiller series was 1000. Taking a 30-year mortgage on $1,000 yields a monthly payment of roughly $4.72 (at April's 3.91% prevailing mortgage rate). Run that calculation for the whole real house price series and you get the blue line.
For me, the interesting observations here are that home prices, when looked at in terms of payments in real dollars, are cheaper now than they have been since the Case-Shiller index came into being. Also, the late 80s / early 90s regional housing mini-bubble shows up more prominently when you look at it in terms of real borrowing costs instead of real house prices.
